- It allows you to create interactive views such as Kanban or Dashboards using Gemini without sharing the entire spreadsheet.
- It offers the possibility of generating independent links with audience control and automatic or static data updates.
- It is available for specific Google Workspace plans and requires the file to be stored in Google Drive.
- It facilitates data editing directly from the canvas interface without needing to return to the grid view.

If you've ever felt that sharing an entire spreadsheet is too much when you only want to show a specific chart or dashboard, Google has a solution. Now you can turn your data into a kind of visual mini-app , known as a canvas, which can be shared via a custom link without the user having to navigate through all the tabs of your file.
This functionality, powered by Gemini's artificial intelligence, transforms the traditional grid into interactive and dynamic interfaces . Its most powerful feature is the ability to separate editing permissions for the original document from the visibility of the canvas, giving you much finer control over who sees what and how that data is presented to the outside world.
How to create an interactive canvas with Gemini
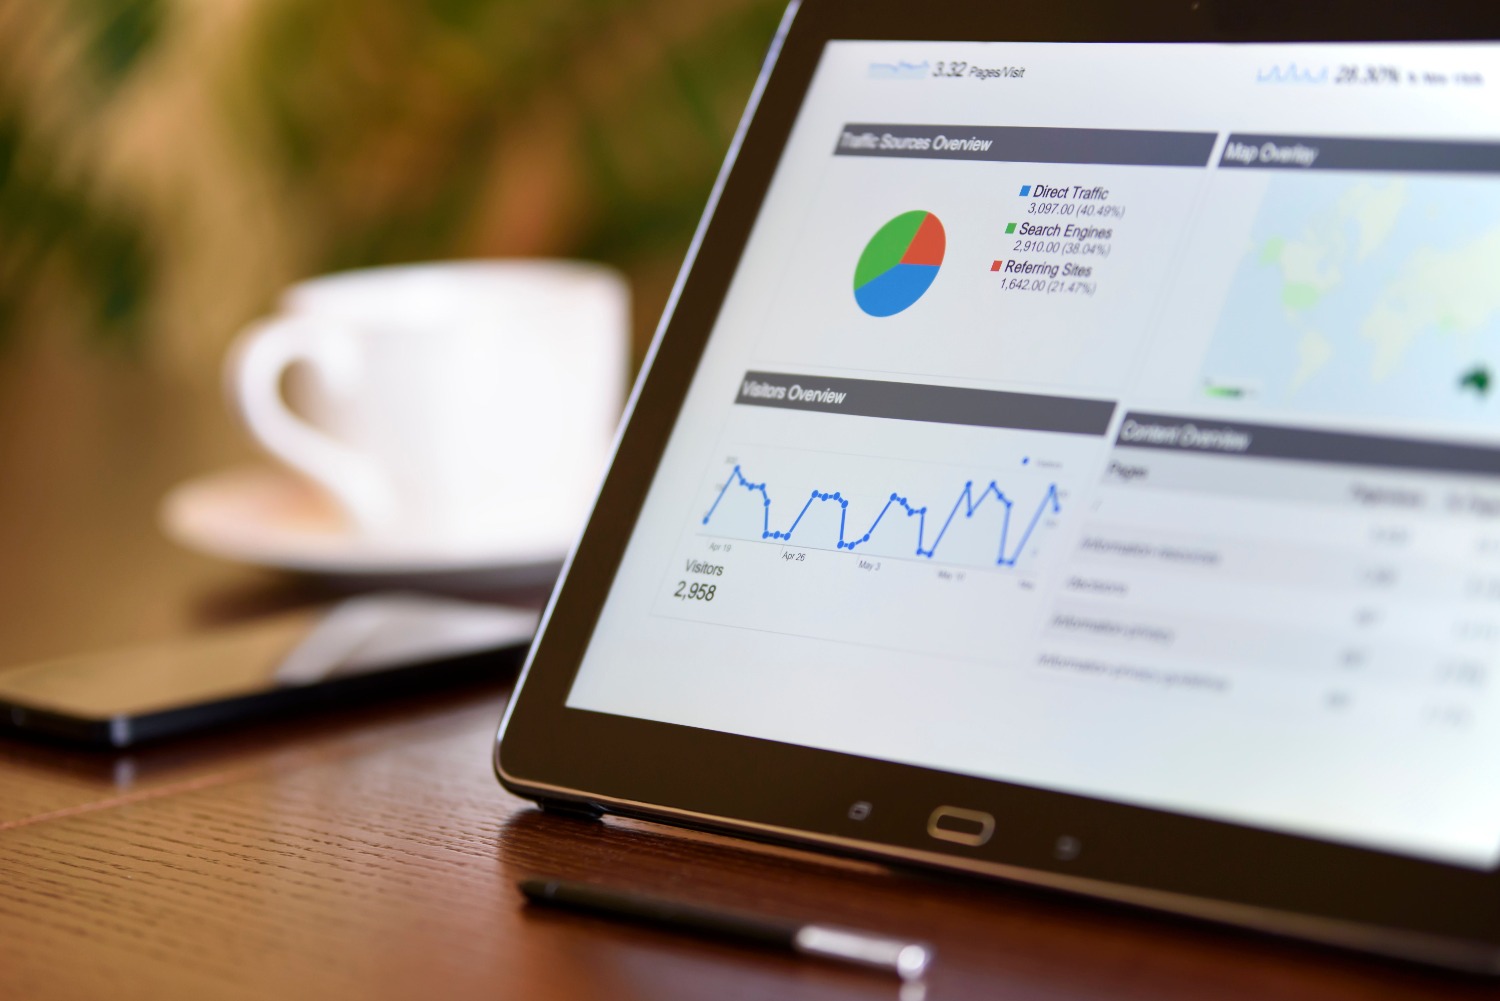
To start building your own custom view, you'll need to work from a computer and have a Google Sheets file in standard format. If you have an Excel file, the first step is to save it as a Google Sheet so that all the AI functions work smoothly. Once you're in Google Sheets, simply ask Gemini to generate the visualization you need.
There are various options depending on what you're looking for. For example, you can create Kanban boards to manage tasks by dragging and dropping items, gallery views that organize information into elegant cards, or interactive calendars to track release dates. You can even design complex dashboards to monitor your business's stock, prices, or ratings. If you're not entirely satisfied with the result, you can always ask the AI to make adjustments, such as switching the design to dark mode.
Publishing the canvas as a separate link
The real magic happens when you share. Google lets you generate a separate link that functions as a read-only view. This means you can keep your spreadsheet restricted to a very small group of people, while the canvas is published for a much wider audience, whether within your organization or even anyone on the internet.
It's crucial to understand that the editor can choose whether the information updates automatically or maintains a static view over time. Furthermore, publishing can be stopped at any time. However, caution is advised: while the user doesn't have access to the original file, the underlying data that feeds the canvas is sent to the browser, making it less than ideal for hiding top-secret information.
Technical requirements and limitations

Not everyone can use this feature immediately. The rollout is gradual and tied to specific Google Workspace plans, such as Business Standard, Plus, and Enterprise , as well as Google AI Pro and Ultra accounts. If you use a Business Starter account, you probably won't see the option active. Additionally, there are some technical limitations you should be aware of to avoid frustration.
- It is not possible to create canvases from the aplicación móvil of Spreadsheets.
- If the combined data volume exceeds million cellsthe tool will not be able to process it.
- The file must be hosted in Google DriveLocal files or files from external services will not work.
- To publish on the web, the user must own edit permissions in the document.
Managing and maintaining your views
Once the canvas is created, you have complete freedom to manage it from the top toolbar. You can rename the view to make it clearer for the end user or delete it entirely if it's no longer needed. If you have editing permissions, you don't have to go back to the boring grid: you can modify, delete, or add data directly from the canvas's interactive interface.
For those requiring a more professional level of analysis, Google also offers integration with Looker . Using the Linked Sheets feature, you can create a connection between Looker's exploration and a spreadsheet, enabling the generation of reports and pivot tables based on LookML models. This requires more technical setup, including enabling the Google Sheets API in the Google Cloud Console and creating an OAuth client to securely manage authentication.
Having the ability to transform dry data into a standalone visual experience greatly streamlines communication within any team. By combining Gemini's design power with independent access controls, Google Sheets evolves from a simple spreadsheet into a platform capable of deploying functional mini-apps that maintain the integrity of the source document while delivering a streamlined and professional user experience .
FAQ
What exactly is a Google Sheets canvas?
It is a visual and interactive interface generated by Gemini's AI that transforms tab data into dashboards, calendars, or control panels.
Can I publish a canvas without people seeing my original spreadsheet?
Yes, the standalone linking feature allows the audience to view the canvas visualization even if they do not have access permissions to the source file.
Which Google Workspace plans include this feature?
The tool is intended for users of Business Standard, Plus, Enterprise Standard and Plus, as well as Google AI Pro and Ultra plans.
Can the data be edited directly from the canvas?
Users with editing permissions can add, modify, or delete information directly on the canvas interface without using the grid.
Are there data limits for creating a canvas?
The function is not compatible with datasets that exceed one million cells by combining the source tabs.
Can I create canvases from my mobile phone?
No, creating interactive canvases is currently only available for the desktop version of Google Sheets.
Is it safe to post sensitive data on a standalone link?
Caution is advised as the underlying data is sent to the reader's browser, so it does not automatically protect confidential information.
