- Dashboards visualize key information, facilitating decision-making in businesses and for personal use.
- They offer clear representation of data through graphs and KPIs.
- They allow access to real-time data and are customizable according to needs.
- Tools like Power BI help create interactive and collaborative dashboards.
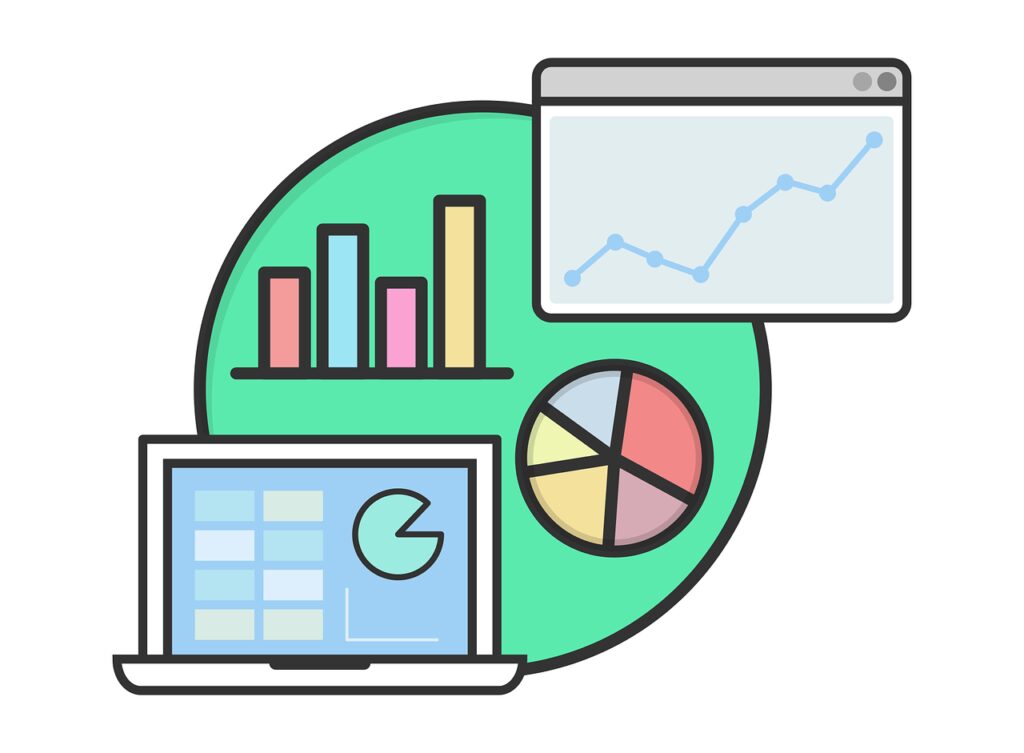
What is a Dashboard?
Visual information
Access
So, What is a Dashboard?
What does a Dashboard offer?
Data visualization
Real-time information
Personalization.
Interactivity
Accessibility
Applications for creating Dashboards
- Microsoft Power BI
- Instrument
- Google DataStudio
- Qlik View
- Domo
- Clipfolio