- R8 removes code and resources that no one uses, rewrites the rest, and shortens names to create smaller apps with faster startup times and fewer unresponsiveness.
- It is advisable to enable optimization in the release build and adjust the conservation rules, which are the main obstacle preventing R8 from working at full capacity.
- R8's Configuration Analyzer measures how much code is available to shrink, optimize, and obfuscate, and flags broad, duplicate, or useless rules.
- Completing the task with App Bundles, lightweight images, language and density adjustments, and constant size measurement makes a real difference in download speed.

Compressing an Android app isn't just about deleting individual files; it's a delicate balancing act between size, startup speed, and memory usage. Android's built-in optimizer, R8, handles much of this work without you having to write a single line of code : it analyzes which code and resources are actually being used, removes what no one is using, and rewrites what remains to run with less overhead. What users of your app notice is faster startup times, less memory usage, a smoother interface, and fewer crash messages.
The key is to give it room to work. The larger the portion of your codebase that R8 can touch, the better the results. Overly broad conservation rules are the most common obstacle , because they lock down classes and methods that might not be called dynamically, along with their dependencies. Refining these rules, measuring, and retesting is the loop that separates a simply released app from a truly fine-tuned one.
What exactly does R8 do and why should you trust it?
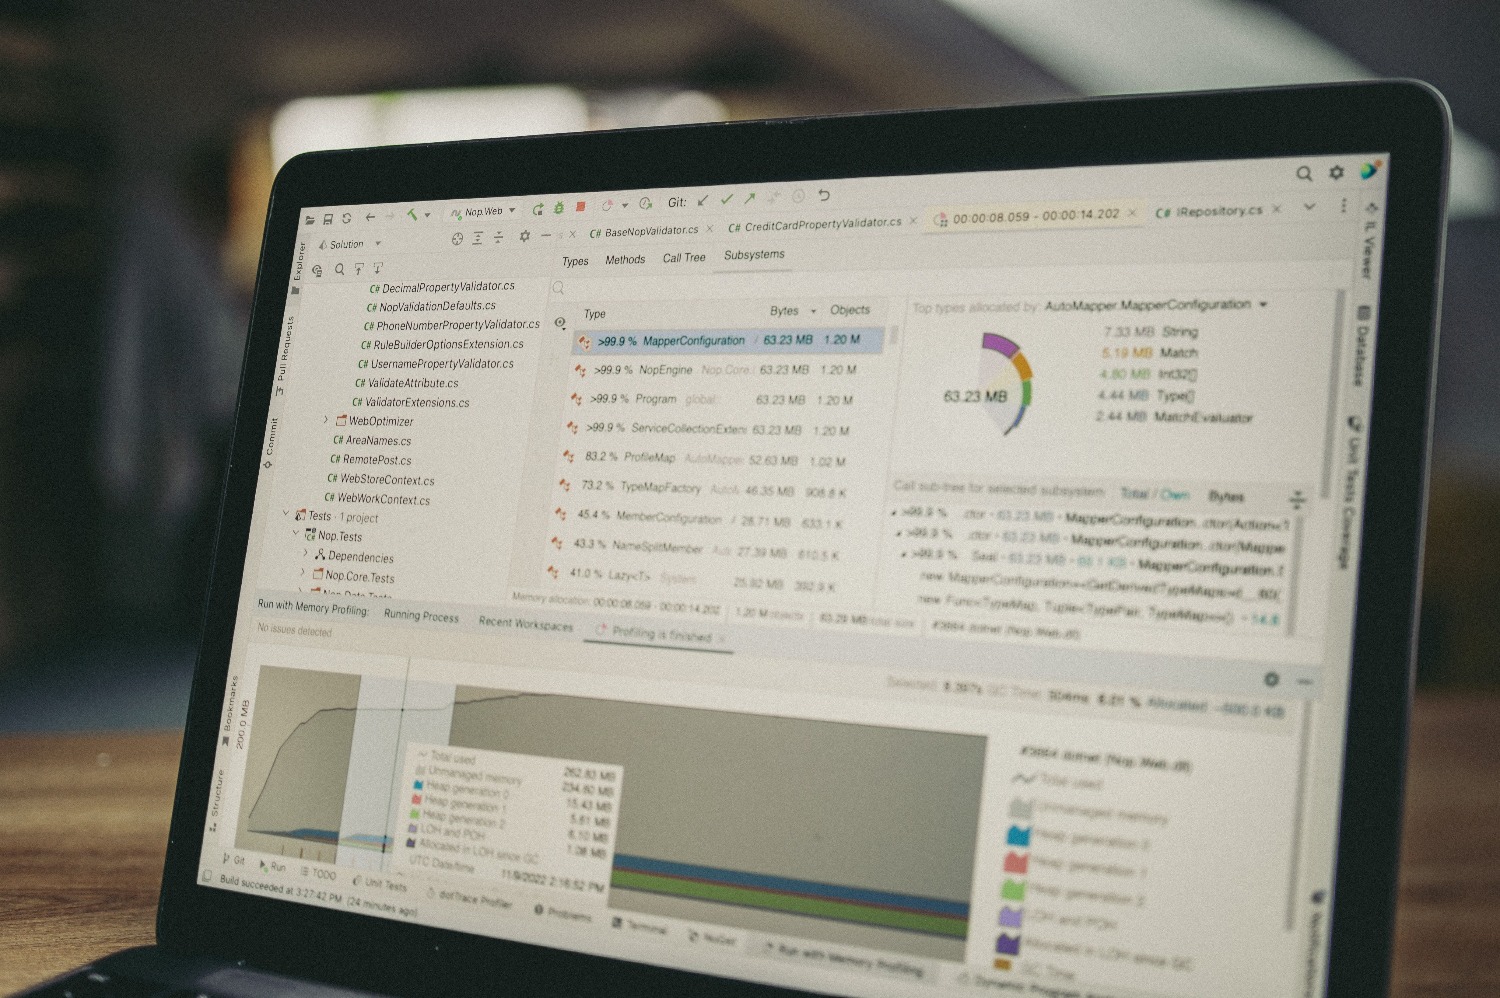
R8 works in a series of linked phases. First, it analyzes your actual entry points, such as the activities or services declared in the manifest, builds a map of everything referenced, and discards anything outside that map . Then, it moves into logical optimizations: replacing calls with the body of the called method, merging classes and interfaces, simplifying structures, and reducing execution overhead. Finally, it shortens the names of classes, fields, and methods, so something like com.example.MyActivity can end up being called aba, with the resulting savings in metadata.
- Less dead codeDependencies that you only use in a small percentage stop carrying all their weight.
- More efficient execution: Inserting methods and merging classes reduces calls and pressure on memory.
- Lighter DEX filesObfuscation saves metadata and speeds up class loading.
- Adjusted resourcesSince version 8.12 of the Gradle plugin, R8 also participates in resource optimization.
From the user's perspective, this translates to faster startup times, reduced memory consumption, improved rendering, and fewer unresponsive app issues. The official recommendation is clear: enable optimization in the release build . For daily testing or library development, it's usually not worthwhile, because compilation time increases and debugging becomes more complicated when names change.
Enable optimization based on the Gradle plugin version
If you're working with recent versions of the Android plugin for Gradle, things have been greatly simplified. Simply enable a single flag within the optimization block of the release build type and place your keep rules in a specific source code set, with files ending in .keep, for example, within src/main/keepRules. This new approach encompasses both code and resources and includes default platform rules equivalent to the historical ProGuard rules with optimization, so there's no need to declare additional files.
In projects anchored to previous versions of the plugin, the standard approach involves two parameters in the release build type: one that enables code minification and another that enables resource reduction. The sensible approach is to enable both simultaneously and add the optimized rules file generated by the system itself, plus your own rules file if needed. Mixing release builds without these switches is one of the most subtle ways to give away megabytes to your users.
Full mode and optimized resource reduction
R8's full mode has been active by default for years and applies more aggressive assumptions about the use of reflection and dynamic calls. If someone has ever written a property that disables it, it's best to delete it : keeping it off reduces the optimizer's potential. However, full mode can require extra rules in projects with a lot of dynamic code, so always test it with a real release build and not just with unit tests.
Optimized resource shrinking arrived with version 8.12 of the plugin, and since version 9.0, it's applied automatically when resource shrinking is enabled. The idea is to treat resources as part of the code graph : previously, the packaging tool generated preservation rules that kept inaccessible resources and code alive that referenced each other; now, if a collection of code and resources isn't used, it's not protected and disappears. In apps with many form factor variations, size reductions well over fifty percent have been measured.
The R8 Configuration Analyzer and its three scores

This analyzer is the tool that tells you whether your configuration is helping or hindering. It generates statistics on what percentage of your codebase is actually subject to reduction, optimization, and obfuscation . If the reduction score is 66 percent, it means R8 can remove code from two-thirds of your codebase; if the optimization score is the same, it can only apply method insertion, class merging, and other techniques to two-thirds. The obfuscation score measures how much code can be shortened to save metadata.
In addition to overall metrics, the report details the impact of each conservation rule and the optimization properties it blocks. It also identifies rules originating from third-party libraries , which is very useful because the authors of these libraries are unfamiliar with your specific implementation and sometimes write rules so general that they paralyze optimization in parts of your app that are completely unrelated to its functionality.
How to generate the report without wasting time
To quickly iterate on your rules, there's a specific Gradle task that analyzes the release configuration without packaging the APK or bundle. The feedback loop is much shorter , and the HTML report appears in the module's reports folder, within a directory dedicated to R8. This is the recommended option when you're fine-tuning rules and want to see the immediate effect of each change.
If you prefer automatic analysis, any release build also generates an HTML file within the mapping results. You can disable this automatic generation with the corresponding experimental property if you find it bothersome. In older versions of the plugin, the workaround is to add a recent R8 version to the project's classpath and run the build with a system property specifying the directory where the report should be saved.
Refine conservation rules without breaking the app
The goal is to preserve only what is truly accessible through reflection, nothing more, nothing less. Start by examining the rules that block optimization across a vast number of classes , reviewing what elements they protect, and verifying whether they are actually invoked dynamically. Then narrow the scope: instead of preserving an entire package with all its members, limit the rule to specific classes and members. And before implementing the change, run tests that cover those affected classes, fields, and methods.
Also, be careful with subsumed rules. If one rule protects an entire package and another protects a class within that package, the second one doesn't contribute anything, and the first one is blocking optimizations you might not need. Decide which of the two is accurate: if the narrow one is well-written, remove the broad one and unlock the rest of the package; if the broad one is correct, remove it anyway but rewrite it so that it only affects what's essential. Then run the analyzer again and compile a full release to verify that everything is still working.
Duplicate, unused, and library rules
The analyzer identifies two clear sources of clutter: rules that don't match any class, method, or field in the current build, and identical rules repeated in the same file or in different files. The former are often left as garbage after refactoring or dependency removal ; the latter complicate maintenance without adding any benefit. Cleaning them up makes the configuration easier to read and debug.
With third-party libraries, there's little room for maneuver because their rules come packaged and you can't selectively edit them. The practical approach is to document the impact in a report and notify the maintainer , or temporarily replicate those rules in your project, excluding the broader ones and measuring the potential gain before deciding if it's worth taking the risk.
ProGuard and R8: similar, but not identical
For years, ProGuard did four things: it removed unused elements, optimized bytecode, obfuscated names, and added pre-checking information. R8 picks up where it left off and pushes further: it inserts methods more aggressively, merges classes, converts enumerations to integers when possible, and has a better understanding of Kotlin's features . It also compiles faster and, with the de-sweetening of the core library, allows the use of modern Java APIs on older versions of Android.
Regarding the rules, R8 accepts those of ProGuard and adds some of its own modifiers, such as those that force or prevent the insertion of a specific method. Name conversion doesn't change the behavior, but it does complicate reading stack traces : it always preserves the mapping file for each release in order to recover the original trace when a production failure occurs.
Typical mistakes when minifying and how to get out of the jam
The same problems keep coming up: "class not found" due to a deleted class, "no such method" due to a renamed method, models that aren't serialized because they've lost their names, or libraries that assume nothing will change. The diagnosis almost always involves checking what's being accessed via reflection and adding the minimum necessary rule . To investigate, enable usage, seed, and mapping printing to a temporary file, or temporarily disable specific optimizations to isolate the culprit.
It's also worth noting that external tools that regenerate or patch DEX files can break the optimizations that R8 has carefully implemented. If your build chain includes such a step, review it before blaming the optimizer . And if build performance is a concern, there are tweaks available to adapt R8 to your environment without sacrificing its benefits.
Reduce resources: images, densities, and languages
Resources typically make up a huge portion of the package. Converting bitmaps to WebP reduces file size while maintaining quality , and vector drawables prevent duplicating the same icon for each density. Configuring only the density buckets you actually use and limiting the included languages significantly reduces file size, especially in apps with many translations. For PNGs that you can't convert, there are compression utilities with minimal loss.
It also helps to programmatically color a single resource to grayscale instead of bundling multiple colored versions, load large, unnecessary images on demand at startup, and remove orphaned resources using the IDE's code inspection. If a resource is referenced only from dead code, optimized reduction detects and removes it , something that didn't happen before because the two processes ran separately.
Layouts, styles, and view hierarchies
Flattening hierarchies doesn't reduce the APK size, but it does improve performance, which is the other half of the goal. Replace unnecessary container nesting with a well-designed ConstraintLayout , extract common components with include, and define styles to avoid duplicate attributes. The layout inspector helps you detect absurdly deep view trees that slow down inflation.
App Bundles, dynamic modules, and native libraries
Publishing in bundle format is a game-changer: the store generates packages tailored to each device, so each user downloads only the code and resources they need. Downloads are significantly lower than with a universal APK because it filters out languages, device densities, and architectures that don't apply. Furthermore, features can be distributed across feature modules that are downloaded on demand, based on conditional or instant criteria.
Regarding native libraries, including only the architectures you support and keeping compression enabled prevents you from including binaries that no one will run. If you compile with Bazel instead of Gradle, you can also integrate R8 into the pipeline, although it's worth remembering that this support isn't officially supported for Android app development.
Measure the size and monitor the evolution

Without measurement, there is no optimization. The IDE's APK analyzer shows you the true size of the package, and a custom Gradle task can report the size after each build. Adding this check to continuous integration automates size control and prevents a couple of new dependencies from bloating the binary without anyone noticing.
How has the behavior changed between versions?
It's worth reviewing the recent evolution because it explains many legacy configurations that are no longer relevant. Version 8.0 enabled full mode by default ; 8.6 improved retracing, including file and line retracing for any minSdk; 8.12 introduced optimized resource reduction and automatic retracing in Logcat; 9.0 enabled it by default, filtered global options in consumer rules, and optimized Kotlin null checking; 9.1 repackaged classes by default; and 9.3 introduced the simplified optimization block and the .keep rule set.
With all this in mind, what truly makes a difference is a simple routine: enabling optimization in release, reviewing the analyzer report periodically, trimming unnecessary rules, cleaning up resources and images, distributing with bundles, and measuring the size with each release. These are small steps that, combined, transform a heavy, slow app into one that downloads in a flash and launches instantly . And since the code and dependencies keep growing, the review must be continuous: what's fine-tuned today becomes out of tune as soon as a new library is added or a feature with its own resources is incorporated.

FAQ
What exactly does R8 do with my application code?
It analyzes the declared entry points, builds a reference map, and removes anything that isn't reachable from them. Then it rewrites the remaining code to run with less overhead and shortens class, field, and method names to save space.
How do I enable R8 optimization in the latest versions of the Gradle plugin?
It's activated with a flag within the optimization block of the release build type, which covers both code and resources. Your own rules go in a specific source code set, in files with the .keep extension.
What is the difference between reducing code and reducing resources?
Code reduction eliminates unreachable classes, fields, and methods, while resource reduction removes unused images, layouts, and other files. In modern versions, both tasks are integrated into a single reference graph, preventing the retention of linked resources solely from obsolete code.
What is the R8 Configuration Analyzer used for?
Measure the percentage of your codebase that remains available for shrinking, optimizing, and obfuscating, and break down the impact of each preservation rule. With this data, you can identify overly broad rules, duplicates, and rules that no longer match anything.
Why does a broad conservation rule hurt my app's performance?
Because it prevents R8 from touching not only what that rule protects, but also everything that depends on it. The result is more code in the package, more metadata, and less room to apply method insertion or class merging.
Is it better to publish with App Bundles instead of a universal APK?
Yes, because the store generates packages tailored to each device, and each user downloads only the language, density, and architecture resources they need. This adjustment significantly reduces the download size without requiring you to maintain separate artifacts.
How can I read a stack trace from an obfuscated build?
You need the mapping file that is generated with each release build and to apply the R8 retrace tool. Recent versions even automatically re-trace the traces in the IDE's Logcat window.
Is it worth optimizing a library that I'm going to publish?
Full optimization works best when R8 sees the entire application graph, so the bulk of the work is done when compiling the final app. Even so, a library can carefully prepare its consumer rules to avoid blocking optimizations in projects that integrate it.
Table of Contents
- 1 What exactly does R8 do and why should you trust it?
- 2 Enable optimization based on the Gradle plugin version
- 3 Full mode and optimized resource reduction
- 4 The R8 Configuration Analyzer and its three scores
- 5 How to generate the report without wasting time
- 6 Refine conservation rules without breaking the app
- 7 Duplicate, unused, and library rules
- 8 ProGuard and R8: similar, but not identical
- 9 Typical mistakes when minifying and how to get out of the jam
- 10 Reduce resources: images, densities, and languages
- 11 Layouts, styles, and view hierarchies
- 12 App Bundles, dynamic modules, and native libraries
- 13 Measure the size and monitor the evolution
- 14 How has the behavior changed between versions?
- 15 FAQ