- Implementation of an observability ecosystem based on the collection of temporal metrics and their graphical visualization.
- Deployment of specific export agents for GNU/Linux and Windows environments to capture system data.
- Advanced scalability strategies using Thanos and VictoriaMetrics for massive data storage.
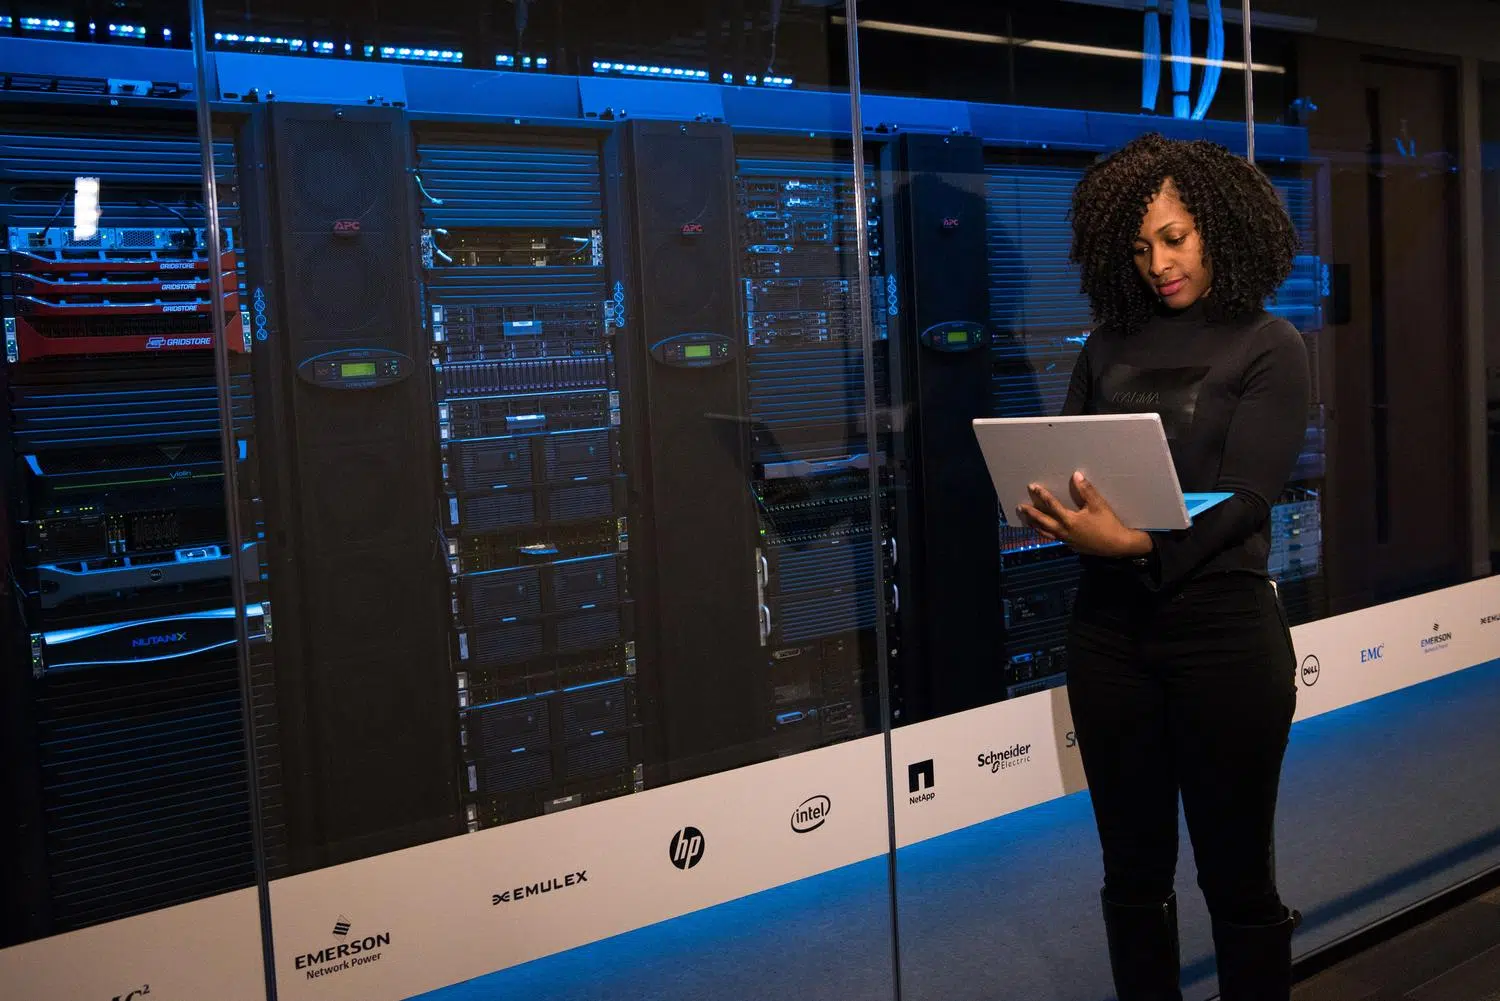
Today, keeping a close eye on what's happening within our technology infrastructure is not a luxury, but an absolute necessity. Continuous system monitoring allows us to anticipate problems before the end user notices anything wrong, preventing a minor error from escalating into a complete service outage that keeps us up at night.
To achieve this, a winning combination has been implemented: the pairing of Prometheus and Grafana. While the former collects and stores metrics in a time series database, the latter provides a powerful visual interface that transforms those numbers into easily understandable graphs.
Fundamentals of end-to-end monitoring
When we talk about proactive monitoring, we mean not waiting for the server to crash before taking action. An Application Performance Management (APM) monitoring approach allows you to observe the entire path a request takes, detecting bottlenecks or performance errors in real time. This is vital because, historically, we've gone from manually checking physical indicators in the 80s to using automated tools that now give us a comprehensive view of the infrastructure.
Implementing this type of monitoring not only reduces downtime but also optimizes operating costs. Furthermore, for everything to run smoothly, efficient API management is essential , ensuring that communication between applications is scalable and secure, thus complementing the monitoring strategy.

Building the stack: Prometheus and Grafana on Linux

To implement this system in a Linux environment, we need three key components. First, the prometheus-node-exporter , which is responsible for publishing the system's metrics on port 9100. It's important to note that, in some distributions like Ubuntu, the systemd garbage collector can generate excessive data (high cardinality), so it's sometimes advisable to disable certain collectors using Ansible to avoid overloading the system, following a comprehensive Linux server optimization guide.
The next step is the Prometheus server, where we configure the file prometheus.ymlThis is where we tell you exactly which equipment should be monitored defining the scrape_configs and the targets (IPs and ports). Once Prometheus starts collecting data every few seconds, Grafana comes into play. This tool is usually installed using .deb packages and allows us to connect Prometheus as a data source then import pre-designed dashboards that save us the work of creating each chart from scratch.

Quick alternative with Docker Compose
If you don't want to deal with manual installations, you can set up the entire environment using containers. Using a docker-compose.yml file , we can orchestrate the Prometheus image, the Grafana image, and the Node Exporter on the same virtual network. To prevent data loss when the container restarts, it's essential to configure persistence volumes on the host's file system.
In this setup, configuration is greatly simplified. We can use YAML files to automatically provision Grafana's data sources , avoiding the need to access the web interface to configure the Prometheus URL. Furthermore, for advanced users, there are options in the configuration JSON that allow changing the query method to POST or managing alerts directly from Grafana.
Extending monitoring to Windows environments
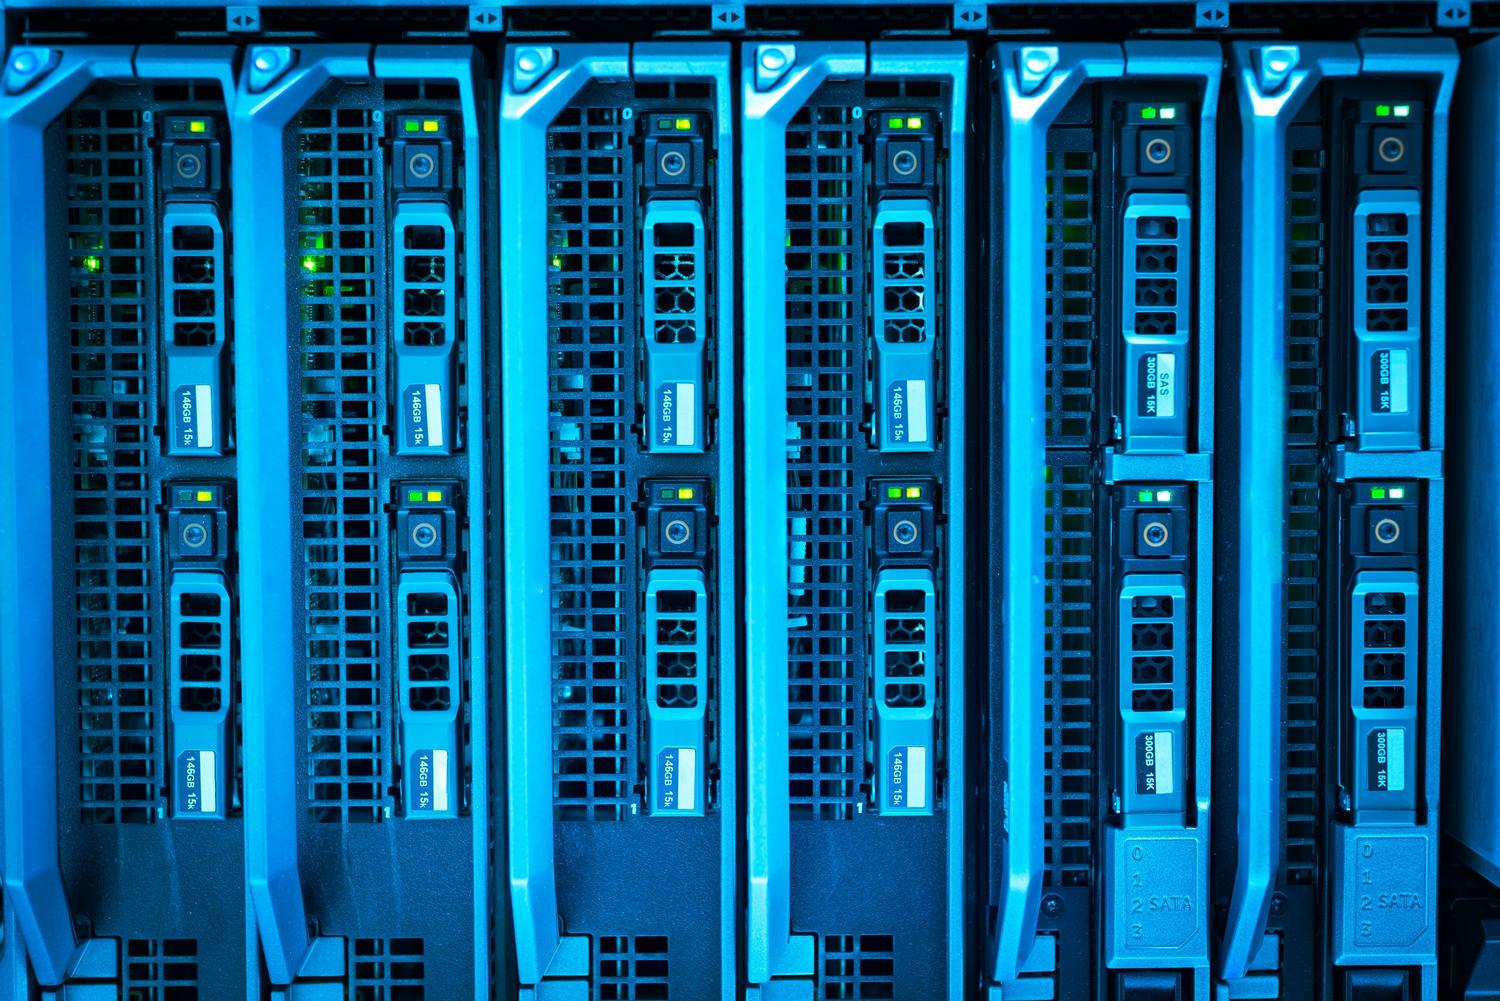
Not everything in the corporate world is Linux; Windows remains a mainstay in many data centers. To integrate these dedicated Windows servers , we use the windows_exporter , which exposes metrics on port 9182. The process is similar: we install the agent on the Windows machine, add the corresponding job in Prometheus, and find a Windows-specific dashboard (such as ID 14694 in the Grafana gallery) to visualize the status of the CPU, memory, and disk.

Solutions for mass storage and scalability
As a company grows and begins managing millions of metrics, Prometheus can start to falter. To address this, tools like Thanos exist , allowing data to be moved to cloud storage such as AWS S3 or Google Cloud Storage, thus providing high availability and long-term retention . Thanos uses a sidecar that accompanies Prometheus and a Query component for federated queries.
Another very powerful alternative is VictoriaMetricsThis solution is particularly efficient in its use of CPU and memory. In complex architectures, it can be used Prometheus-Operator on Kubernetes to manage local collection and subsequently send all metrics to a VictoriaMetrics cluster. This system is divided into components such as vmstorage to save the data, vminsert to write them and vmselect for consultations, allowing management billions of data points without the system slowing down.
The choice between these tools usually depends on the volume of data. While Prometheus is ideal for the short term, combining it with VictoriaMetrics or Thanos is the safe bet for multi-cloud environments where it's necessary to centralize information from dozens of clusters and ensure that data traffic is always encrypted and authenticated using security proxies.
Implementing an ecosystem based on Prometheus and Grafana, reinforced with agents for Linux and Windows and scaled using VictoriaMetrics or Thanos, transforms IT management into a predictable and efficient process. By centralizing metrics and automating alerts, organizations gain complete visibility into their infrastructure, optimizing performance and ensuring business continuity in the face of any unforeseen technical issues.
