- Graphs are mathematical structures that model relationships in various disciplines.
- There are different types of graphs, such as directed, weighted, and bipartite, each with specific applications.
- Graphs are essential in social networks and navigation systems to optimize connections and routes.
- Graph theory is constantly evolving, driven by technological advances and the need for more complex analysis.

1. Types of graphs
Graphs are powerful tools that allow us to model a wide variety of real-world situations. But not all graphs are created equal. In fact, there are several types of graphs, each with its own specific characteristics and applications. Let's explore the most common types and their uses.
Directed vs. undirected graphs
One of the first concepts we need to understand when talking about types of graphs is the difference between directed and undirected graphs.
Undirected graphs: In these graphs, the connections between nodes do not have a specific direction. It's like a two-way street: you can go from A to B and from B to A without restrictions. A classic example is a network of friends in a social network, where friendship is reciprocal.
Directed graphs: Also known as "digraphs," these graphs have edges with a defined direction. It's like a one-way street: you can go from A to B, but not necessarily from B to A. A perfect example is Twitter, where you can follow someone without them following you back.
What’s the significance of this distinction? Well, imagine you’re designing a recommendation system for a streaming platform. If you use an undirected graph, you might assume that if user A likes content B, then user B will also like content A. But we know that preferences aren’t always reciprocal, right? That’s where directed graphs shine, allowing us to model more complex, unidirectional relationships.
Weighted graphs vs. unweighted
Another crucial aspect in graph theory is the concept of edge weights.
Unweighted graphs: In these graphs, all connections have the same value or importance. It's as if all the streets on a map had the same length.
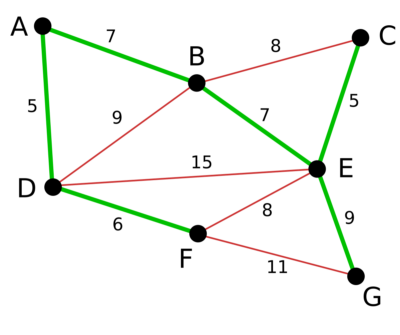
Weighted graphs: Here, each edge has an associated value, which we call a "weight." This weight can represent distance, cost, time, or any other relevant measure. It's like a real map, where each street has a specific length.
The difference is crucial in practical applications. For example, in a GPS navigation system, using a weighted graph allows the shortest or fastest route to be calculated, taking into account the actual distance or travel time between points.
Simple graphs vs. multigraphs
The complexity of the connections between nodes leads us to another important classification:
Simple graphs: In these graphs, there can only be one edge between any two nodes, and loops (edges that connect a node to itself) are not allowed. It's like a social network where you can only be friends with someone once.
Multigraphs: These graphs allow multiple edges between the same pair of nodes and can include loops. A practical example would be a flight network between cities, where there can be multiple flights (edges) between the same two cities (nodes).
The choice between simple graphs and multigraphs depends on the complexity of the relationships we need to model. Multigraphs offer more flexibility, but can also complicate some algorithms and analyses.
2. Special graphs and their applications
Now that we've covered the basic types, let's dive into some special graphs that have unique properties and fascinating applications.
Bipartite graphs
Bipartite graphs are a special class of graphs where nodes can be split into two disjoint sets, and each edge connects a node in one set to a node in the other set. Sounds complicated, right? But in reality, we see them every day.
Imagine an online dating platform. You have two groups: men and women (simplifying, of course). Each connection (match) is between a person from one group and a person from the other. That's a bipartite graph in action!

Another classic example is the job assignment problem. You have a set of workers and a set of tasks. Each edge represents the assignment of a worker to a task. Bipartite graphs are crucial to efficiently solving this type of matching problem.
Planar graphs
Have you ever tried to draw a map without the roads crossing? If you did, congratulations! You have created a planar graph. Planar graphs are those that can be drawn on a plane without any of their edges crossing.
These graphs are essential in the design of printed circuit boards. When you design a circuit board, you want to avoid having traces cross each other, as this could cause short circuits. Planar graph algorithms help optimize these designs.
But not only that, planar graphs are also crucial in game theory. The famous four-color problem, which states that any map can be colored with only four colors without adjacent regions having the same color, is based on properties of planar graphs.
Eulerian and Hamiltonian graphs
These graphs have intimidating names, but fascinating concepts behind them.
Eulerian graphs: A graph is Eulerian if there exists a path that traverses each edge exactly once and returns to the starting point. The name comes from the famous Königsberg bridge problem, solved by Euler in 1736. This concept is crucial in route optimization, such as in the Chinese postman problem (how to design an efficient route to deliver mail).
Hamiltonian graphs: A graph is Hamiltonian if there exists a cycle that visits each node exactly once. Sounds similar to Eulerian, right? But there's a crucial difference: in Eulerian we worry about the edges, in Hamiltonian we worry about the nodes.
The traveling salesman problem, one of the most famous problems in computer science, is based on finding Hamiltonian cycles. Imagine you are a salesman and you need to visit several cities. What is the shortest route that visits each city exactly once and returns to the starting point? That is the traveling salesman challenge, and it is surprisingly difficult to solve efficiently for a large number of cities.
3. Advanced graph structures
As we delve deeper into graph theory, we come across more complex structures that have unique properties and specific applications. Let's explore some of the most interesting ones.
Trees and forests
Trees are a special type of graph that contains no cycles. Imagine a family tree: each person is connected to their parents, but there are no loops in the structure. In computer science , trees are fundamental for organizing data hierarchically.
A forest, on the other hand, is simply a collection of disconnected trees. It may sound simple, but this structure is incredibly useful in many algorithms and applications.
For example, in social network analysis, trees and forests are used to identify communities and hierarchical structures within the network. In file systems, the directory structure is essentially a tree.
Complete graphs
A complete graph is one in which every node is directly connected to every other node. It's like a party where all the guests know each other.
Although they may seem simple, complete graphs are crucial in many optimization problems. For example, in the design of communication networks, a complete graph would represent the ideal situation where every point can communicate directly with every other point.
However, in practice, building and maintaining a complete graph can be expensive and impractical for large systems. Therefore, many algorithms seek to find a balance between the connectivity of a complete graph and the efficiency of simpler structures.
Cyclic and acyclic graphs
The presence or absence of cycles in a graph can have important implications in many applications.
Cyclic graphs: These graphs contain at least one cycle, that is, a path that starts and ends at the same node without repeating edges. Cyclic graphs are common in many real-world systems, such as transportation networks or ecosystems.
Acyclic graphs: As their name suggests, these graphs do not contain cycles. Directed acyclic graphs (DAGs) are particularly important in computer science. They are used to model dependencies in build systems, workflows in data processing, and even in representing history in version control systems like Git.
Detecting and managing loops is crucial in many algorithms. For example, in project planning, a loop might indicate a circular dependency that would make it impossible to complete the project. Loop detection algorithms are critical to identifying and resolving these problems.

4. Practical applications of graph types
Graph theory is not just an academic exercise; it has practical applications in almost every field imaginable. Let's look at some concrete examples of how different types of graphs are used in the real world.
Social media is perhaps the most obvious and ubiquitous example of graphs in our daily lives. Each user is a node, and connections (friends, followers, etc.) are the edges.
Facebook, for example, uses undirected graphs to model friendships: if A is friends with B, then B is also friends with A. Twitter, on the other hand, uses directed graphs: A can follow B without B following A.
But the application of graphs in social networks goes much further. Recommendation algorithms use graph properties to suggest new connections or relevant content. Community detection, crucial for targeted advertising, is based on the analysis of the structure of the social network graph.
Every time you use Google Maps or any other navigation app, you are harnessing the power of graphs. The road map is modeled as a weighted and directed graph:
- Nodes are intersections or points of interest.
- The edges are the roads that connect them.
- The weight of each edge can represent distance, estimated travel time, or even factors such as real-time traffic.
Algorithms such as Dijkstra's or A* are used to find the shortest or fastest route between two points. These algorithms are incredibly efficient due to the special properties of graphs that represent road networks.
Route optimization with graphs
Beyond personal navigation, graphs are essential in logistics and large-scale route optimization. Companies such as Amazon and FedEx use advanced graph-based algorithms to optimize their delivery routes.
The famous “traveling salesman problem” mentioned above is a classic example. Although finding the optimal solution for a large number of points is computationally intensive, there are approximation algorithms based on graph properties that can find very good solutions in reasonable time.
Another fascinating example is airline route optimization. Airlines use weighted graphs to model their route network, where weights can represent factors such as distance, fuel cost, flight time constraints, and even factors such as wind patterns.
5. Fundamental algorithms in graph theory
Graph theory would not be as powerful without algorithms that allow us to analyze and manipulate these structures. Let's explore some of the most important algorithms and how they are applied in real-world situations.
Breadth-first search (BFS): This algorithm explores a graph level by level, visiting all of a node's immediate neighbors first before moving to the next level. It's like throwing a stone into a pond and watching the ripples spread out in concentric circles.
BFS is great for finding the shortest path in unweighted graphs. For example, in a social network, BFS could be used to find the shortest “degree of separation” between two people.

Depth-first search (DFS): Unlike BFS, this algorithm delves as deeply as possible into a branch before backtracking. It's like exploring a maze by following a wall until you can't go any further, and then backtracking to try another path.
DFS is useful for detecting cycles in a graph, which is crucial in many applications. For example, in a build system, DFS can be used to detect circular dependencies between modules.
Dijkstra's algorithm
Dijkstra's algorithm is the workhorse for finding the shortest path in weighted graphs. It is at the heart of many GPS navigation systems.
How does it work? Imagine you're in an unknown city and you want to get to a destination. You start by exploring the nearest streets, always opting for the shortest route known so far. Gradually, you discover more efficient routes until you reach your destination.
Although Dijkstra is efficient, it has one limitation: it does not work well with negative weights. For such cases, there are alternatives such as the Bellman-Ford algorithm.

Graph coloring
Graph coloring is a fascinating problem with surprising applications. The goal is to assign colors to the nodes of a graph such that no pair of adjacent nodes has the same color.
Sounds simple, right? But determining the minimum number of colors needed (the “chromatic number” of the graph) is a computationally difficult problem for general graphs.
However, coloring algorithms have important practical applications:
- Frequency allocation in mobile networks: Nearby base stations need different frequencies to avoid interference.
- Scheduling: At a university, two classes that share students cannot be scheduled at the same time.
- Assignment register in compilers: Variables that are used simultaneously need different registers.

6. Tools and software for working with graphs
In the digital age, we're no longer limited to drawing graphs on paper. Numerous software tools and libraries make working with graphs much easier. Here are some of the most popular:
- NetworkX: A Python library for studying the structures, dynamics, and functions of complex networks. It is ideal for data scientists and academics.
- Gephi: A visualization and exploration platform for all types of graphs and networks. Perfect for creating powerful social media or quote visualizations.
- Neo4j: An database graph that allows data to be stored and queried in graph form. Widely used in recommendation and fraud detection applications.
- Cytoscape: Originally developed for biology, this open source tool is excellent for visualizing and analyzing molecular interaction networks.
- GraphViz: A collection of tools for drawing graphs specified in graph description languages. Very useful for generating diagrams automatically.
These tools not only make working with graphs easier, but they also allow you to discover patterns and relationships that might not be obvious at first glance.

7. Challenges and future trends in the study of graphs
The field of graph theory is constantly evolving, driven by technological advances and new needs in areas such as machine learning and artificial intelligence . Some of the most exciting challenges and trends include:
- Dynamic graphs: Most real-world graphs change over time. Developing efficient algorithms for dynamically evolving graphs is an active area of research.
- Large-scale graphs: With the rise of Big Data, we need algorithms and data structures that can handle graphs with billions of nodes and edges.
- Deep learning on graphs: Graph neural networks (GNNs) are gaining popularity in tasks such as link prediction and node classification.
- Privacy & Security: As more sensitive data is modeled as graphs, ensuring the privacy and security of this data becomes crucial.
- Quantum Computing: The Algorithms Quantum machines promise to revolutionize how we approach certain graph problems, potentially solving in seconds problems that would take years on classical computers.
Conclusion: The importance of graph types in data science
Graph types are much more than just mathematical structures; they are powerful tools that allow us to model and analyze the world around us. From social media to navigation systems, from molecular biology to artificial intelligence, graphs are everywhere.
Understanding different types of graphs and their properties is not only critical for data scientists and programmers, but for anyone who wants to better understand how complex systems work in our interconnected world.
As we move towards an increasingly digital and connected future, the importance of graphs will only continue to grow. Whether you’re designing the next great recommendation algorithm, optimizing logistics routes, or simply trying to better understand the connections in your professional network, knowledge about graph types will give you an invaluable advantage.
So the next time you're using your favorite social network, planning a trip, or even trying to decide what show to watch next based on your previous tastes, remember: behind those seemingly simple experiences, there's a fascinating world of graphs working for you.
Share this article with your friends and colleagues if you found it useful! Together, we can unravel the web of knowledge that connects our world.