- Kernel memory dumps capture the system state in critical failures and are essential for debugging and security auditing.
- In Windows, they are analyzed with WinDbg or KD, using symbols and commands such as !analyze -vy .bugcheck to locate drivers and causes of the error.
- In Linux, tools like crash, LiME, and gcore allow you to extract and study kernel and process dumps, with special attention to protecting sensitive data.
- FreeBSD and other Unix systems require kernels compiled with symbols and the use of kgdb, always relying on documentation and source code to interpret results.
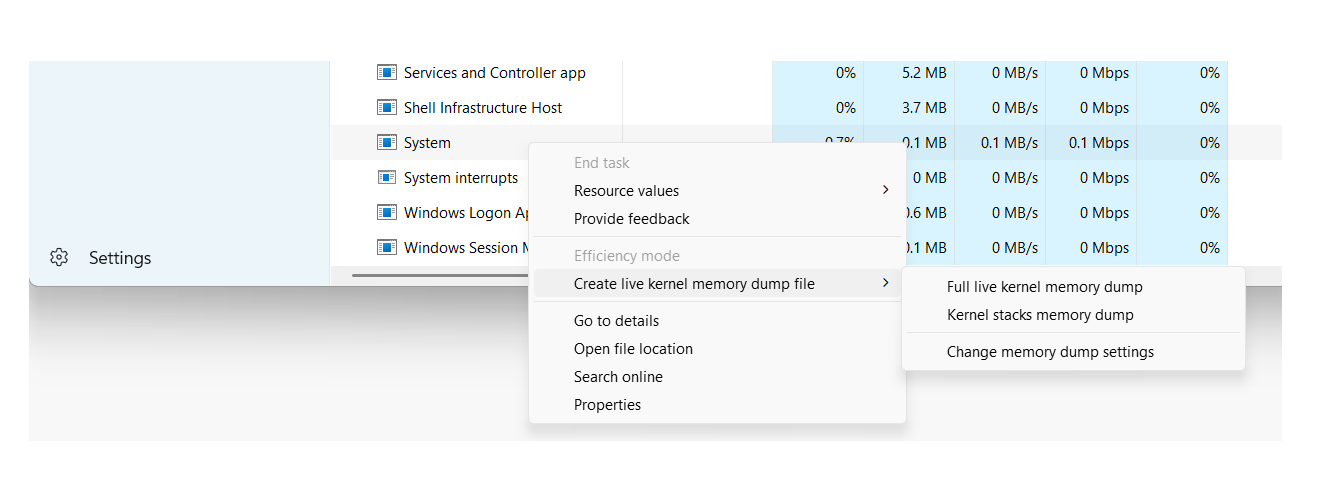
When an operating system panics or crashes, the only way to understand what happened is to take a kernel memory dump and analyze it . These dumps capture the system's internal state at the moment of the failure and are essential for debugging complex errors, investigating security incidents, or conducting forensic examinations.
Although it might sound very "low-level," memory dump analysis isn't exclusive to kernel developers. System administrators, support engineers, and even security auditors can benefit from it if they know the right tools, the different types of dumps, and basic interpretation techniques . We'll walk you through all of this on Windows, Unix/Linux, and BSD, using tools like WinDbg, crash, kgdb, and LiME.
What is a kernel memory dump and why is it worth analyzing?
A kernel memory dump (often called a Kernel Crash Dump or simply a crash dump ) is a file that contains a copy, either full or partial, of the memory at the time the system suffers a critical failure, such as a kernel panic in Unix/Linux or a blue screen of death (BSOD) in Windows.
In practice, a dump of this type saves internal kernel structures, call stacks, process context, and loaded drivers . Thanks to this, after the disaster, a post-mortem analysis can be performed that is very similar to debugging a live system, but without the pressure of having to touch a production machine while it is failing.
The reasons for delving deeply into kernel dumps are varied: from debugging seemingly random bugs and intermittent crashes , to investigating whether a system has been maliciously manipulated or whether a crash may have left traces of sensitive information on disk.
In addition to full core dumps, there is the possibility of taking dumps of individual processes (the classic core dumps ), which are very useful when we want to limit a problem to a specific application or check the impact on the confidentiality of a service such as an email or messaging client.
Types of memory dumps in Windows and their usefulness
On Windows systems, the operating system itself can generate different types of dumps when a STOP error occurs. Each type includes a different level of detail, so it's crucial to know which type of dump you need depending on the problem and disk space limitations.
One of the most common formats in user environments and many servers is the small memory dump (minidump)It is the one that consumes the least space and is usually located in %SystemRoot%\Minidump, with files of the style MiniMMDDYY-01.dmp.
This mini dump contains very specific but important information: the STOP error code and its parameters , the list of drivers loaded at the time of the failure, the context of the processor that stopped (PRCB), the contexts of the process and thread involved (EPROCESS and ETHREAD structures) and the kernel-mode call stack of that thread.
Thanks to these basic structures, even with a minidump it is often possible to identify which driver or module is causing the crashes, although it will not always be possible to follow the entire trail if the problem originates far from the thread that was running at the time of the crash and the available context information is limited.
Windows can also generate kernel memory dumps and much larger full dumps that contain portions or all of the physical memory. These are especially useful for low-level analysis, forensic investigations, and advanced debugging of drivers or the system itself.
Configure and open memory dumps in Windows with WinDbg and KD
To take advantage of system dumps in Windows, the first step is to properly configure startup and recovery options . From the Control Panel, in the advanced system properties, you can choose the type of dump you want to generate in case of a failure: for example, a "Small memory dump (256 KB)" and the path where it will be stored.
The system also requires a paging file on the boot volume of at least a few megabytes to write the dump. In modern versions of Windows, each crash creates a new file, and a history is maintained in the configured folder, allowing for easy review of past incidents.
Once generated, there are several ways to validate that the dumps are correct. A classic utility is Dumpchk.exe , which allows you to check the basic integrity of the file and print summary information. For more advanced analysis, Windows Debugging Tools are used , including WinDbg (graphical interface) and KD (command-line version).
After installing the debugging package from the Microsoft website, the tools will typically be located in a folder such as C:\Program Files\Debugging Tools for Windows . From there, you can open a command prompt and load a dump file using WinDbg or KD, specifying the file with the -z parameter .
windbg -y <RutaSimbolos> -i <RutaBinarios> -z <RutaDump>
The symbol path can point to a symbol server with local caching , for example:
srv*C:\Symbols*https://msdl.microsoft.com/download/symbols
While the binary path is usually something like C:\Windows\I386 or the folder where we have copied the system executables corresponding to the version that generated the dump. This is important because Minidumps do not include all binaries, only references to them, so the debugger needs to be able to find them.
Basic analysis of a kernel crash dump in Windows
Once the dump is loaded using WinDbg or KD, analyzing a kernel crash dump is quite similar to a post-mortem debugging session. The first command almost everyone runs is `!analyze` , which launches an automated analysis and generates an initial report.
The command !analyze -show shows the bug check code and its parametersWhile !analyze -v It produces a much more detailed output: suspect module, call stack, contextual information and, in many cases, suggestions about possible causes or diagnostic steps.
To complement that analysis, the .bugcheck command prints the error code and associated parameters again, which can be compared with Microsoft's bugcheck code reference to find out the exact meaning of each value and typical causes.
The command lm N T (list modules) allows you to see the List of loaded modules with their path, addresses and statusThis helps confirm whether the driver identified by the automated analysis is actually in memory and what version it is. This list is especially useful when we suspect third-party drivers or security components that interact with the kernel.
If desired, we can simplify loading dumps by creating a batch file that receives the path to the dump and launches KD or WinDbg with the appropriate parameters. This way, we only need to write a short command that includes just the file location, and the script takes care of everything else.
Using WinDbg for deep kernel dumps
For kernel-mode memory dumps, WinDbg also offers the ability to work with multiple files and sessions. Dumps can be opened from the command line with -z , or from the graphical interface using the File > Open Memory Dump menu or the keyboard shortcut Ctrl+D.
If WinDbg is already open in passive mode, simply select the file in the "Open crash dump" dialog box, specifying the path or browsing the disk. Once loaded, you can start the session with a "g" (Go) command in certain scenarios, or directly launch the initial analysis commands.
In addition to the classic !analyzeIt is advisable to become familiar with the debugger command reference sectionThis describes all the available commands for reading internal structures, examining memory, interpreting stacks, and much more. Many of these techniques are applicable to both live sessions and offline dumps.
WinDbg also allows you to work with multiple parallel dumpsWe can add multiple -z parameters on the command line, each followed by a different filename, or add new targets using the command .opendumpDebugging multiple destinations is useful for comparing recurring failures or chained incidents.
In some environments, memory dumps are packaged into CAB files to save space or facilitate transmission. WinDbg can directly open a .cab with a dump inside, both using -z and with .opendumpalthough he will read It will only extract one of the dumped files and will not extract other files. that could go in the same package.
Crash dumps in Unix and Linux: utility, tools and requirements
In Unix and GNU/Linux systems, the philosophy is similar, but the ecosystem of tools differs considerably. Most Unix-like kernels offer the ability to save a copy of memory when a catastrophic event occurs , which is known as a core dump or kernel crash dump.
Although their primary use remains kernel and driver development, these dumps have a clear security aspect. A crash can be caused by programming errors, but also by failed malicious actions, attempts to manipulate system components, or clumsily exploited race conditions.
In a well-configured Unix system, daily crashes are uncommon, but when they do occur, it's advisable to have a dump infrastructure in place, such as Kdump, LKCD, or other solutions that allow you to capture system memory. However, it's crucial to weigh both the diagnostic value of the dump against the risk of it containing highly sensitive data.
One of the most comprehensive and widely used tools for this type of analysis in Linux is crash , initially developed by Red Hat. This utility has become practically a de facto standard for examining kernel dumps and also for analyzing running systems.
Crash can work against the system's live memory through /dev/mem or, in Red Hat and derivative distributions, using the specific device /dev/crashEven so, it is common practice to feed the tool with a dump file generated by mechanisms such as Kdump, makedumpfile, Diskdump or architecture-specific dumps like s390/s390x or xendump in virtualized environments.
The role of crash and the importance of vmlinux in Linux
The crash utility was created, in part, to overcome the limitations of using gdb directly on /proc/kcoreAmong other things, access to that memory pseudo-image may be restricted, and, in addition, certain kernel compilation options make it difficult to properly interpret the internal structures if we only have the compressed executable binary.
For crash to work correctly, two key elements are required: a compiled vmlinux file with debugging symbols (usually with flags like -g) and the kernel dump itself. This combination allows the tool to map memory addresses to functions, structures, and lines of code.
It is important to distinguish between vmlinux and vmlinuzOn most systems, only vmlinux is visible, which is a compressed, bootable version of the kernel. Crash requires the symbolically decompressed vmlinux; without it, when attempting to load a dump or /dev/mem We will encounter errors of the type cannot find booted kernel — please enter namelist argument.
Although it's possible to manually extract vmlinuz, the process isn't always straightforward, and in practice, it's often much more convenient to recompile the kernel to obtain both vmlinux and vmlinuz simultaneously. In serious administration environments, it's good practice to maintain a separate vmlinuz package for each deployed kernel version specifically for these situations.
Once the requirements are met, running crash against a dump is relatively simple: you specify the appropriate vmlinux and dump file, and the tool opens an interactive session from which you can explore kernel structures, list processes, view call stacks, and extract forensic information . Those who want to delve deeper can consult specialized documentation, such as the well-known crash technical whitepaper.
Limitations of /dev/mem and first approaches in Linux
Before resorting to specific tools, many administrators have historically tried to obtain a memory dump. reading directly from the device /dev/memThis approach seemed simple: use a tool like memdump (which dumps that device to STDOUT) or pull from dd if=/dev/mem of=volcado.mem.
However, modern kernels offer compilation options such as CONFIG_STRICT_DEVMEMwhich severely limit access from user space to /dev/memThe typical result is that the read is cut off after a small block (e.g., 1 MB) or, in the worst case, a bug in that interaction can end in a kernel panic immediate and machine restart.
This protection makes perfect sense from a security standpoint, but it forces us to look for other ways to obtain a reliable and complete dump without relying entirely on generic devices that are no longer as accessible as before.
Hence the current trend is to rely on specific modules or integrated crash dump infrastructures, instead of simply trying to "scrape memory" with user space tools that are not designed to coexist with modern kernel protection policies.
LiME Forensics: Memory Extraction in Linux and Android
A very powerful alternative in the forensic world is LiME (Linux Memory Extractor) , a kernel module designed precisely to capture volatile memory in a controlled manner and without the restrictions that affect /dev/mem. LiME runs in kernel space, so it can access RAM much more directly.
LiME is distributed with its source code and compiles against the kernel headers in useThe compilation process generates a module .ko specific to the kernel version it will be loaded into. Once compiled, we can verify it with tools such as file to ensure that the ELF module corresponding to our architecture has been correctly generated.
To use LiME, simply load the module with insmod from root and pass it the appropriate options, for example by specifying a network dump destination using TCP and a raw format:
insmod lime-3.x.y.ko "path=tcp:4444 format=raw"
In parallel, on the machine that will receive the dump, we listen on the configured port using a tool like ncredirecting the output to a file:
nc <IP_origen> 4444 > volcado.mem
After a few minutes, depending on the amount of RAM and network performance, we'll have a file whose size matches the physical memory of the source system. This is a complete RAM dump that we can analyze with forensic tools or even with strings or other utilities as a first step to locate interesting strings.
Process dumps and data exposure risks
A full kernel dump is extremely informative, but it can also be excessive when we're only interested in a specific process. In that case, it makes a lot of sense to resort to... individual process dumps using tools like gcore in Unix/Linux.
These per-process dumps are much smaller and more manageable, and allow you to focus your analysis on specific applications such as a messaging client (e.g., Skype) or an email client (e.g., Thunderbird), where it is relatively easy to find plaintext passwords, session tokens, or contact data by exploring memory strings.
From a development perspective, these core dumps help locate programming errors, memory leaks, or inconsistent states in a service. However, from a security perspective, the problem arises when these dumps are generated routinely and stored in locations accessible to other users , either on the system itself or on shared network resources.
If a user schedules, for example, a task cron By periodically capturing dumps of sensitive processes and leaving them in a globally readable directory, an attacker is opening a huge door to the exposure of critical information. In many audit scenarios, analyzing these files allows an attacker to recover credentials, contact lists, communication histories, and other private data with relatively low effort.
Therefore, in any serious audit of a Unix system, it is advisable to dedicate a few minutes to checking if dumps (full or partial) are being generated, where they are stored, what permissions they have, and if there is any automated process that is leaving memory copies within reach of unauthorized users.
Post-mortem analysis of dumps in FreeBSD with kgdb
In the BSD world, and specifically in FreeBSD, the approach to post-mortem analysis involves Enable crash dumps on the system and have a kernel compiled with debugging symbolsThis is controlled from the kernel configuration directory, usually in /usr/src/sys/<arq>/conf.
In the corresponding configuration file, symbol generation can be enabled with a line like this:
makeoptions DEBUG=-g # Build kernel with gdb(1) debug symbols
After modifying the configuration, the kernel must be recompiled. Some objects will be regenerated (such as trap.o) due to the change in the build files. The goal is to obtain a kernel with the same code as the one that has problems, but adding the necessary debugging informationIt's advisable to compare the old and new sizes using the command size to ensure that there have been no unexpected changes in the binary.
Once the kernel with symbols is installed, we can examine the dumps with kgdb as described in the official documentation. Not all symbols may be complete, and some functions may appear without line numbers or argument information, but in most cases the level of detail is sufficient to trace the problem.
There is no absolute guarantee that the analysis will resolve all incidents, but in practice, this strategy works quite well in a high percentage of scenarios , especially when crash dumps are combined with a good review of recent changes to the system.
Best practices for analyzing and documenting kernel errors
Regardless of the operating system, kernel dump analysis usually ends up referring to technical documentation, knowledge bases, specialized forums, or even the kernel source code itself to interpret messages, error codes, and unfamiliar symbols.
In Linux, it's very helpful to rely on the official source code tree, the built-in documentation, and community resources. Many kernel error messages can be traced back to the exact file where they originate, which helps in understanding the context in which a particular BUG() or WARN() is triggered.
In Windows, Microsoft documentation, its knowledge base (KB), and technical forums provide detailed explanations of bugcheck codes, troubleshooting recommendations, and known error patterns . Combining this information with the reports from !analyze -v makes it possible to develop a reasonable mitigation plan.
The true value of a crash dump emerges when all that information is cross-referenced with a solid understanding of the operating system and the specific environment where the failure occurred . Only then can lasting solutions be developed and, above all, the same problem be prevented from recurring in the future with more serious consequences.
Kernel dump analysis is, ultimately, a blend of science and craftsmanship: it requires appropriate tools, prior configuration (symbols, dump options, secure storage), and a good deal of experience reading stacks, structures, and error codes. Mastering these techniques allows us not only to debug complex incidents but also to dramatically increase the security and resilience of the systems we manage.