- Windows includes powerful tools (Task Manager, SFC, Memory Diagnostic, CHKDSK, and PC Health Check) to monitor the overall health of the system without installing anything else.
- Free applications such as CPU-Z, HWMonitor, CrystalDiskInfo, AIDA64 or HWiNFO allow you to monitor temperatures, voltages, disks, RAM, CPU and GPU to anticipate hardware failures.
- There are specific utilities for network and security (WiFi Analyzer, Angry IP Scanner, Malwarebytes, SysInspector) that help rule out connection problems or malicious software.
- Knowing the installed hardware and evaluating its actual performance makes it easier to decide whether maintenance and minor changes are sufficient or if it is worthwhile to upgrade key components.
Almost everyone notices sooner or later that their computer takes forever to boot up, makes strange noises, or freezes unexpectedly. What many people don't do is stop to check the health of their PC components until it's too late and something breaks or they lose important data.
The good news is that, with the right tools, you can monitor the health of your hardware and operating system without opening your computer tower or taking it to a repair shop. Windows includes several diagnostic utilities, and there are also plenty of free programs that help you monitor temperature, disks, memory, CPU, GPU, network, and even system security.
Why it's worth monitoring the health of your PC components
A neglected computer will eventually cause problems: applications that take ages to open, random crashes, unexpected restarts, fans running at full speed … All these symptoms usually indicate performance problems, temperature issues, or system errors that should be addressed as soon as possible.
Performing regular checks allows you to detect problems with your RAM, CPU, or hard drive before they fail , avoid blue screens, identify resource-intensive processes, and check if your PC meets the requirements for future versions of Windows.
Furthermore, keeping the system in good working order helps extend the lifespan of the hardware, avoid unpleasant surprises with data loss , improve stability in games or demanding programs, and determine whether it's worth upgrading components or if they can still last a while longer.
Native Windows tools for checking PC health
Before installing anything, it's a good idea to take full advantage of what Windows already includes, because it contains several utilities designed specifically to diagnose hardware, performance, and system file problems without relying on external software.
Task Manager and Startup Programs
The Task Manager has become a quick control panel for seeing what's throttling your PC. From the Performance tab, you can monitor CPU, RAM, disk, network, and even GPU usage in real time , with graphs showing the load at any given moment.
The Processes tab makes it easy to identify applications that are consuming a lot of CPU or RAM , allowing you to terminate them directly. Additionally, the Startup section lets you disable programs that load automatically at startup and are often responsible for your computer taking forever to become operational.
On modern computers, the task manager also displays data such as current processor speed, memory usage, uptime, disk type , and GPU usage, which is very useful for seeing if something is putting too much strain on the machine.
Performance Monitor
Performance Monitor is a more advanced tool integrated into Windows that allows analyze in detail the long-term behavior of the systemIt opens with the Windows + R combination, typing perfmon and pressing Enter.
From there, you can generate automatic diagnostic reports that include CPU, memory, disk, and network usage , as well as create custom counters and alerts when a component spikes above certain thresholds. It's ideal for pinpointing bottlenecks that aren't immediately obvious.
System File Checker: SFC
When Windows starts behaving strangely for no apparent reason—odd errors, menus that won't load, random crashes—it's possible that some system files are corrupted. That's where SFC (System File Checker) comes in, using the command `sfc /scannow`.
Executed in a console with administrator privileges, this command scans all critical system files, compares them with an official backup stored on Windows itself, and replaces any corrupt or modified files with their clean version.
It can often resolve serious problems, including certain blue screens and File Explorer errors , without requiring a full system format. If even SFC fails to repair the system, it usually indicates that the Windows image is corrupted, and you'll need to use the DISM tool to download components from Microsoft's servers.
Windows memory diagnostics
Faulty RAM modules cause very frustrating problems: unexpected restarts, random application errors, different blue screens of death each time … To isolate whether the problem is with the memory, you can use the Windows Memory Diagnostic.
When you launch it, the system prompts you to restart your computer to run a series of tests outside of Windows. The test usually takes between 5 and 10 minutes, and upon completion, the system displays a report indicating whether any errors were found in the RAM . If it detects errors, you should consider replacing the affected modules.
CHKDSK to check the disk
When the hard drive or SSD starts to show signs of fatigue —files that won't open, error messages when copying data, freezes in the middle of a transfer— it's advisable to run CHKDSK with repair parameters.
From the console, the command chkdsk C: /f /r analyzes the volume in search of bad sectors, errors in the file system structure and reading problems, trying to recover the readable information and marking the damaged areas so that they are not used again.
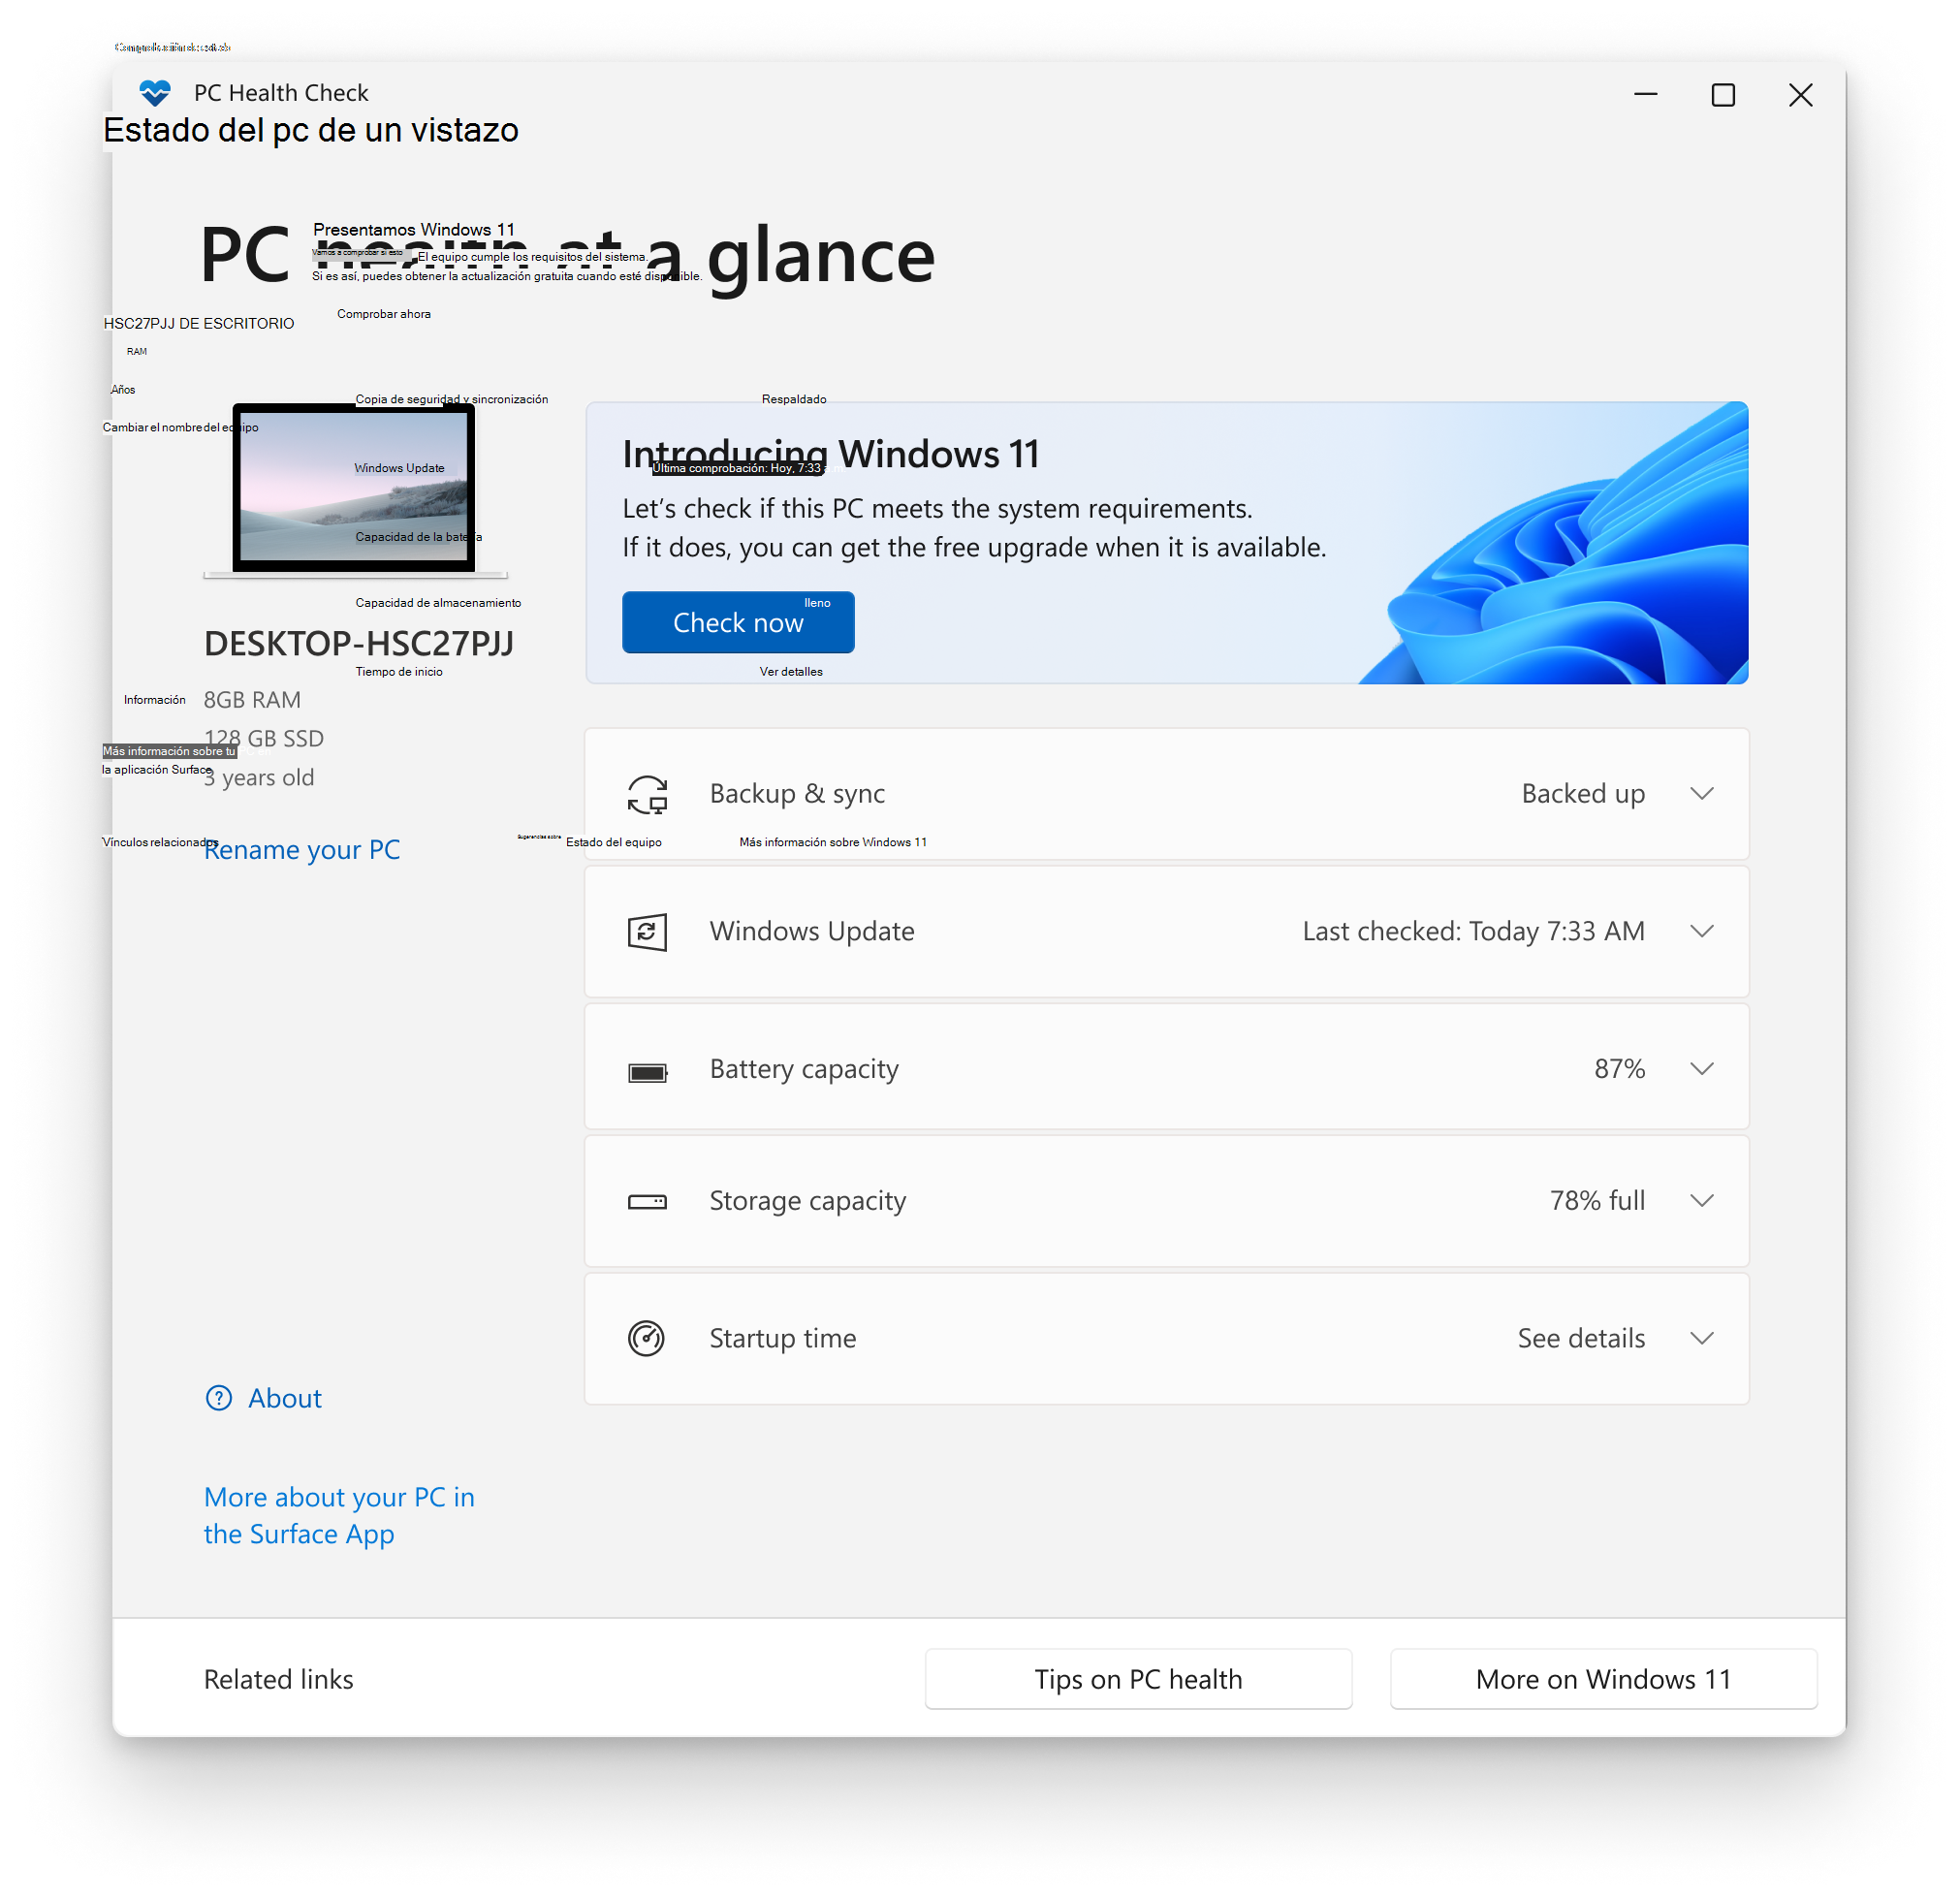
PC Health Check
Microsoft also offers the free tool PC Health Check, which focuses primarily on checking if your computer meets the requirements to upgrade to Windows 11 , although it also takes the opportunity to show a summary of the overall system health.
Once installed on Windows 10 or later, the app checks elements such as CPU, RAM, TPM presence and version, available storage, battery status on laptops , and whether the system is ready for future updates. In return, it shows you basic recommendations to improve your PC's performance.
Programs to identify and monitor PC hardware
Beyond Windows tools, there are many free and freemium applications that allow you to know in minute detail the installed components , their temperatures, voltages, frequencies and possible stability problems.
CPU-Z and CPU-X: complete processor, motherboard and memory specifications
CPU-Z is one of the oldest and most popular utilities for Windows for obtaining detailed technical information about the CPU, motherboard, and RAM . Its user-friendly interface organizes the data into tabs.
The processor section displays the exact model, number of cores and threads, real-time internal frequency, voltage, cache, and supported instructions . It also indicates the motherboard manufacturer, chipset, BIOS version, and all the details of the memory modules (type, size, latencies, active channels, etc.).
It's especially useful if you've overclocked, because it allows you to check live whether the applied frequencies and voltages are as expected . For Linux, there's a virtually identical equivalent called CPU-X, which offers the same type of information adapted to the GNU/Linux environment.
GPU-Z: Everything about your graphics card
For the graphics section, GPU-Z focuses on providing a complete overview of the GPU. Upon opening it, it displays the exact graphics card model, installed VRAM, bus type, BIOS and driver versions , as well as supported technologies.
Its sensors tab allows you to monitor GPU temperature, workload, clock speed, memory usage percentage, and fan speed in real time. It's a key tool for detecting overheating or thermal throttling issues when you notice sudden drops in gaming performance.
Speccy: a summarized and exportable view of the system
Speccy is a freemium utility designed to display hardware information clearly, even for less advanced users . The summary screen shows the main specifications of the processor, motherboard, RAM, drives, operating system, and graphics card at a glance.
It also includes sensor readings, displaying CPU, motherboard, disk, and GPU temperatures —perfect for detecting if any component is overheating. Another very practical feature is the ability to save the report in XML or text format, or capture a snapshot to share in forums or with technical support.
AIDA64 / HardInfo: Advanced diagnostics and stress tests
AIDA64 has become a go-to tool for advanced users who want complete control over their hardware. Although it's a paid program, it offers limited trial versions that demonstrate the extent to which it breaks down all system information across dozens of pages.
It includes specific sections for motherboard, CPU, GPU, RAM, storage devices, networking, sound, graphics APIs , and much more. It also allows you to perform stress tests to check system stability under load, a feature highly valued by overclockers and users who push their PCs to the limit.
One interesting feature is its support for external displays to show real-time temperatures, power consumption, and frequencies . On Linux, HardInfo performs a similar function, offering detailed hardware reports, basic benchmarks, and sensor analysis.
HWiNFO: professional-level monitoring
HWiNFO is another free tool capable of reporting on and monitoring virtually any sensor on your motherboard, CPU, GPU, or storage drives . Its developers boast that even organizations like NASA use it for certain systems.
It offers two main views: an extensive list with detailed specifications for each device and a sensor window where you can track temperatures, voltages, fan speeds and consumption in real time, with recorded minimums and maximums.
It also allows you to generate comprehensive reports to document hardware changes and how they affect performance, or export sensor data for later analysis. It even includes a feature to search for driver versions based on the detected component.
Open Hardware Monitor and HWMonitor: detailed temperatures and voltages
Open Hardware Monitor is an open-source project that stands out for its focus on temperature, voltages, and fan speeds . It reads sensors from the motherboard and processor, as well as those from many Intel, AMD, and NVIDIA graphics cards.
Its interface lists all components with their current, minimum, and maximum values, allowing you to see at a glance whether the CPU or GPU is operating at reasonable temperatures or if any fans are running too slowly. It's compatible with Windows and some Linux distributions and requires no installation.
HWMonitor, developed by the creators of CPU-Z, offers something very similar: real-time monitoring of temperature, voltage, and RPM of CPU, GPU, hard drive, motherboard, and case fans. The Pro version adds advanced features, but the free version is sufficient for monitoring the overall thermal health of your system.
Checking storage health: CrystalDiskInfo and others
The hard drive or SSD is one of the most delicate components, because a serious failure usually means data loss if you don't have backups . Luckily, most modern drives implement SMART technology, which allows you to analyze their internal health.
CrystalDiskInfo: SMART status of hard drives and SSDs
CrystalDiskInfo is probably the most widely used free tool for checking the health of hard drives and SSDs in Windows. Upon opening it, it displays, for each drive, the current temperature, firmware, serial number, interface, transfer mode, power-on hours, and a color-coded overall health diagnostic.
When the status appears in blue, the disk is considered healthy . If it turns orange, the tool warns that the drive could fail at any time and recommends backing up your data and preparing a replacement. If it appears in red, the situation is critical, and ideally, you should migrate your data immediately.
In addition to these indicators, CrystalDiskInfo details SMART attributes such as reallocated sectors, read errors, power cycles , and other values that help anticipate serious problems.
WinDirStat and system cleaning tools
When your PC runs out of space, performance suffers. WinDirStat is a small Windows program that analyzes disk usage and displays it graphically with colored blocks indicating how much space each file and folder occupies . It's very useful for locating large files or extensions that are filling up your drive.
Combined with utilities like CCleaner, which allows you to remove temporary files, clean caches, manage startup programs, and delete duplicate files , you can free up a good amount of space and, incidentally, speed up system startup and overall response.
Memory, CPU and GPU diagnostics: controlled stress
In addition to reading sensors and parameters, it is sometimes necessary to stress test components to confirm whether unstable behavior is due to a hardware failure or something else.
Memtest86+: intensive RAM test
Memtest86+ is a classic tool for checking the integrity of RAM. It runs outside the operating system and subjects the modules to a battery of read and write tests for as long as necessary.
If your computer experiences random freezes, strange errors, or unexplained restarts , it's a good idea to run Memtest86+ and let it complete several full scans. Any errors that appear on the screen usually indicate faulty memory modules or memory incompatibilities.
Intel Processor Diagnostic Tool: Processor Health
For Intel processors, the company itself offers the Intel Processor Diagnostic Tool, a Windows utility that checks CPU functionality, frequencies, voltages, and stability . In addition to displaying detailed chip information, it includes moderate stress tests.
If you're experiencing crashes that you suspect might be caused by the CPU, this tool helps determine whether the problem lies with the processor or another component . If it detects errors, it will typically recommend processing a warranty claim or checking the cooling system.
FurMark and other GPU tests
For graphics cards, FurMark is a very aggressive stress test designed to push the GPU to its limits and check its stability and maximum temperature . It generates an intense graphics load that spikes power consumption and heat, making it ideal for detecting cooling problems.
Use it wisely: if you see the temperature getting too high, it's best to stop the test, improve ventilation, or clean the dust before continuing. In combination with GPU-Z or HWMonitor, you can monitor the temperature in real time.
Monitor network and connectivity: WiFi Analyzer and Angry IP Scanner
Not all performance issues are related to internal hardware. Often, the feeling of sluggishness stems from a congested Wi-Fi connection or conflicts within the local network , and there are free tools available to analyze these issues.
WiFi Analyzer: Wireless Signal Quality
Apps like WiFi Analyzer allow you to check on mobile devices which channels nearby networks use, what signal strength you have at each point in the house , and how saturated your environment is.
With this information, you can choose the least congested channel on your router, reposition your equipment, or add repeaters if the signal is very weak. Often, improving the health of your wireless network eliminates dropouts, latency spikes, and speed drops that seemed like PC problems.
Angry IP Scanner: Quick analysis of the local network
Angry IP Scanner is a cross-platform tool (Windows, macOS, and Linux) that scans IP address ranges in minutes to detect which devices are connected, which ports they have open, and what latencies they exhibit.
It is very useful for locating IP hops, address conflicts, equipment that should not be connected , or services that are responding too slowly on the internal network.
Security and software: rule out logical problems
Not everything that appears to be a hardware failure actually is. Sometimes malware, outdated drivers, or systems overloaded with digital junk can mimic the symptoms of a failing component.
Antivirus and antimalware: Malwarebytes and company
In addition to the main antivirus (for example, Windows Defender), it is advisable to have specific tools such as Malwarebytes on hand, designed to detect and remove malicious software that escapes the classic antivirus.
A full scan with this type of program can discover adware, Trojans, or malicious add-ons that are consuming resources, opening unwanted connections, or causing apparent instability in the system.
Maintenance utilities: space cleaners and optimizers
Programs like CCleaner, Advanced SystemCare, Glary Utilities, or Iolo System Mechanic combine multiple functions: cleaning temporary files, startup management, basic repair of registry entries , and, in some cases, minor performance tweaks.
Used in moderation and always downloaded from their official websites, they can help lighten heavily loaded systems, remove remnants of uninstallations , and automate maintenance tasks that would otherwise be done manually.
Specialized tools and advanced diagnostics
There are also more specific utilities that address specific problems or provide very detailed reports of the entire system , both in Windows and in other operating systems.
ESET SysInspector: System X-ray
ESET SysInspector is a free tool that thoroughly analyzes the system and gathers critical information about running processes, loaded drivers, network connections, suspicious registry entries , and other elements that may be causing instability.
It can be used as a standalone application or integrated into ESET security products, and is very useful for diagnosing complex problems that mix software and hardware , such as driver conflicts or services that interfere with the proper functioning of the computer.
Belarc Advisor, Wise System Monitor and other “all-in-one” programs
Belarc Advisor generates a very comprehensive report that combines hardware inventory with a list of installed software, security status, applied patches , and detected drivers. It's perfect for getting a complete overview of your computer and seeing what might be outdated.
Wise System Monitor offers a more streamlined view of your system, displaying active processes, CPU and RAM usage, real-time network usage , and a quick overview of your main hardware. This allows you to close unnecessary processes and check for anything that might be saturating your connection.
How to see PC components without opening the tower
If you don't feel like taking anything apart—or simply don't want to take any risks—there are many ways to find out what processor, motherboard, RAM, and graphics card you have using only software, on Windows, macOS, and Linux.
Windows options: DirectX, System Settings and Tools
The DirectX diagnostic tool (DxDiag) is opened by pressing Windows + R and typing dxdiagAfter a few seconds, it shows Basic computer specifications: model, BIOS, processor, RAM and, in tabs like Display or Sound, details of the GPU and audio drivers.
From Settings > System > About, you can also see the computer name, processor type and speed, installed RAM, and operating system type . While it's just a summary, it's often enough to know what you have installed.
If you want to go a step further, the System Information tool (msinfo32) lists all the PC's components and devices in an orderly fashion under the Components section, from the network card to the storage devices, with considerable technical detail.
Device Manager, Command Prompt, and BIOS/UEFI
Device Manager displays, category by category, display adapters, network devices, Bluetooth devices, audio devices, storage controllers , and other hardware. Double-clicking each item shows the manufacturer, model, driver version, and other information.
If you prefer something quick from the console, the command systeminfo offers a basic list with Windows version, system manufacturer, model, processor type, physical memory and other relevant information. It's not as comprehensive as some other options, but it's immediate.
For those who are curious, entering the BIOS/UEFI at startup (using Delete, F2, F10, or similar, depending on the motherboard) allows you to see the motherboard model, processor details, clock speed, amount and type of RAM , and advanced configuration options. However, it's best not to touch anything if you're unsure what you're changing.
View hardware on macOS and Linux
On a Mac, the Apple menu > About This Mac displays a summary with the model, processor, memory, serial number, and macOS version . Clicking System Report opens the System Information application, which provides a comprehensive tree view of hardware, network, and software.
In Linux, a very straightforward method is to open the terminal and enter sudo lshw | lesswhich lists in detail CPU, GPU, memory, storage devices, network, and other componentsAnother alternative is to explore the /proc directory, where the system exposes a lot of hardware data in the form of virtual files.
Evaluate hardware quality: performance, size, and upgrades
Knowing what components you have is good, but it's also important to know if they're still up to par or if they've fallen short of your needs , especially in terms of processor, memory, graphics card, and storage.
Processor cores and frequency
Today, almost all processors are multi-core, but having more cores doesn't necessarily make a chip faster. Each core is a processing unit capable of executing its own instruction cycle (read, decode, execute, write).
More cores allow for processing more tasks in parallel, but the speed at which they operate depends on the clock frequency, measured in GHz . That's why a dual-core processor with a high clock speed can outperform a slow quad-core processor under certain workloads.
In addition, the architecture, internal cache, manufacturing process, and, very importantly, whether or not the software you use takes advantage of multiple cores all come into play . Many programs don't scale well beyond a certain point, so it's worth considering both the number of cores and the CPU's frequency and generation.
Motherboard and tower form factors
The motherboard size (ATX, microATX, mini-ITX, eATX) greatly influences upgrade options, cooling space, and the type of case you can use . ATX and eATX offer more PCIe slots and better airflow, but they take up more space.
More compact form factors like microATX or mini-ITX allow for small tower builds, ideal for living rooms or desks with limited space, but they typically involve fewer expansion slots, shorter graphics cards, and fewer drive bays . When assessing the long-term health of the system, it's also important to consider how much upgrade potential the platform offers.
Winaero and simple benchmarks
Tools like Winaero allow you to run small synthetic tests inspired by the old Windows performance benchmarks (the scores we saw in Windows 7 and 8). They assign a score to the processor, RAM, graphics, and hard drive, using modern hardware as a reference.
With just one score, you can quickly identify which component is holding the system back the most . If, for example, everything scores high except the hard drive, it might be time to upgrade from an HDD to an SSD instead of replacing the entire PC.
Keeping your PC components healthy isn't just for experts: with built-in Windows utilities and a few free tools, you can monitor temperatures, check disks, test memory, analyze your network, and detect malware before it turns your computer into a headache. Setting aside some time every now and then to check these things, physically clean your computer, and make backups makes all the difference between a PC that's always "on the edge" and one that runs smoothly for years.
Table of Contents
- 1 Why it's worth monitoring the health of your PC components
- 2 Native Windows tools for checking PC health
- 3 Programs to identify and monitor PC hardware
- 3.1 CPU-Z and CPU-X: complete processor, motherboard and memory specifications
- 3.2 GPU-Z: Everything about your graphics card
- 3.3 Speccy: a summarized and exportable view of the system
- 3.4 AIDA64 / HardInfo: Advanced diagnostics and stress tests
- 3.5 HWiNFO: professional-level monitoring
- 3.6 Open Hardware Monitor and HWMonitor: detailed temperatures and voltages
- 4 Checking storage health: CrystalDiskInfo and others
- 5 Memory, CPU and GPU diagnostics: controlled stress
- 6 Monitor network and connectivity: WiFi Analyzer and Angry IP Scanner
- 7 Security and software: rule out logical problems
- 8 Specialized tools and advanced diagnostics
- 9 How to see PC components without opening the tower
- 10 Evaluate hardware quality: performance, size, and upgrades