- Real-time network traffic monitoring allows for anticipating failures, improving performance, and strengthening the security of the IT infrastructure.
- Open source tools such as Nagios, Zabbix, Prometheus, Cacti, OpenNMS, Icinga, Netdata, LibreNMS or Observium offer advanced features without license costs.
- The combination of metric collectors, time series databases, and visualization layers like Grafana and Graphite creates highly flexible and scalable solutions.
- Defining requirements, applying best practices, and conducting a proof of concept are key to choosing and deploying the most suitable monitoring platform.
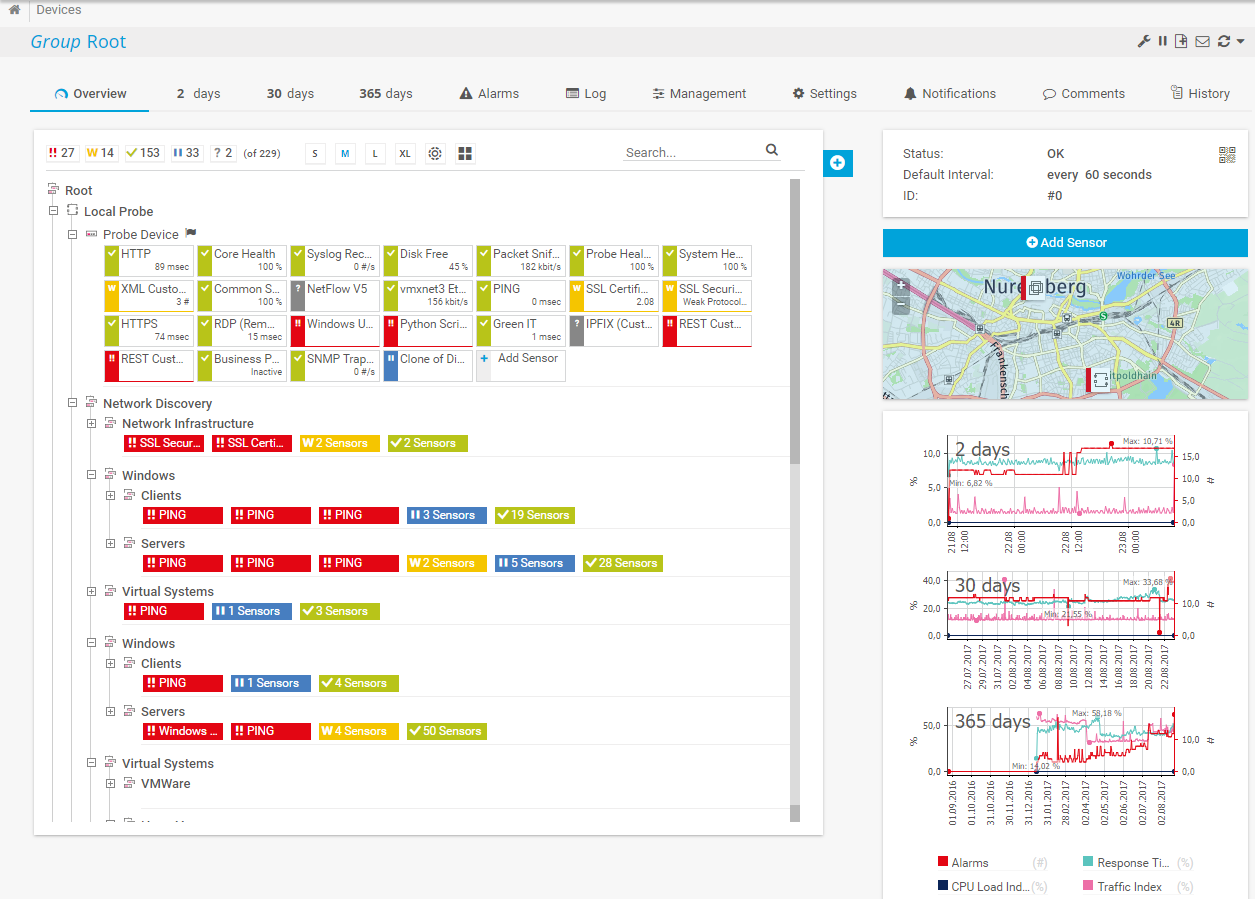
When a company's network starts to slow down, the Wi-Fi drops, or a critical server crashes at the worst possible moment, simply "restarting the router and crossing your fingers" is no longer enough. Today, it's crucial to have open-source network traffic monitoring tools that allow you to see what's happening in real time, anticipate problems, and avoid costly downtime.
If you work in IT, networking, or have ever been the technical lead at your company, you've probably heard of solutions like PRTG or SolarWinds… and their licenses. The good news is that there's a very mature ecosystem of open-source platforms for monitoring devices, services, and network traffic (routers, switches, Wi-Fi access points, servers, containers, public clouds, and much more) without exorbitant fees and with incredible flexibility.
What is real-time network traffic monitoring and why is it so important?
When we talk about real-time network monitoring, we're referring to the continuous supervision of the status, performance, and security of IT and communications infrastructure , detecting incidents the moment they occur. The software constantly collects and analyzes metrics from devices, systems, and applications so that the IT team can react before the problem impacts the business.
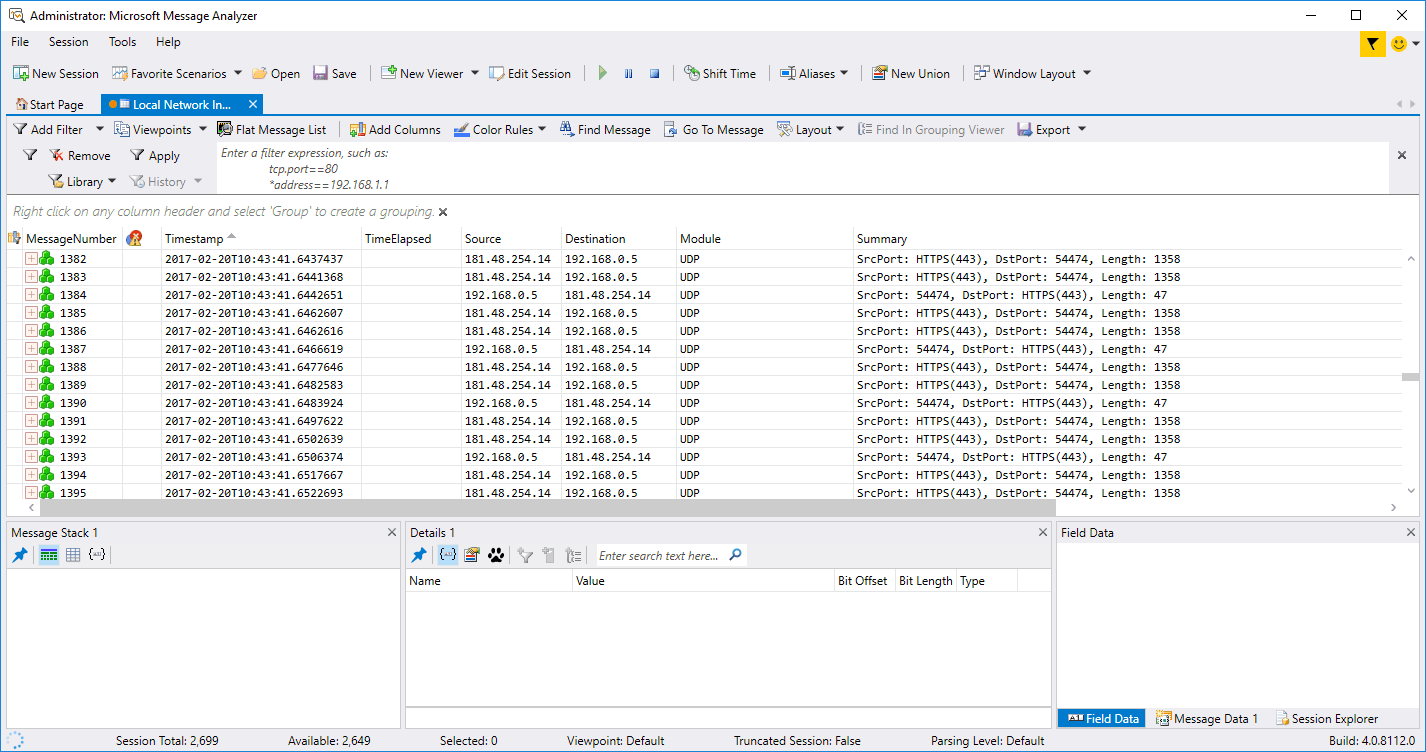
These types of solutions rely on protocols such as SNMP, NetFlow/sFlow, ICMP , APIs and specific agents to collect data from routers, switches, firewalls, access points, physical and virtual servers, containers, cloud services, web applications, databases and virtually any element that is part of the infrastructure.
The main objective is to have complete visibility into traffic, bandwidth usage, availability, and the health of each component . This allows for the detection of bottlenecks , attacks, hardware failures, or service overloads before they result in outages, widespread slowness, or data loss.
In addition to live data, many tools allow you to store historical metrics for trend analysis , capacity planning, SLA/OLA compliance verification, security auditing, and support for investment decisions in new equipment or links.
Main uses and benefits of real-time monitoring
One of the biggest benefits is the preventative maintenance of IT and network infrastructure . Having continuous metrics on CPU, memory, temperature, power supply status, interface errors, and packet loss helps detect early signs of failure before a serious breakdown or service outage occurs.
Early incident response is another key pillar. Monitoring platforms generate customizable alerts (email, SMS, Slack, Teams, webhooks, etc.) when a value exceeds a threshold, a service becomes unresponsive, or a suspicious traffic pattern appears. This dramatically reduces downtime and the impact of security incidents or performance outages.
In day-to-day operations, monitoring contributes to optimizing the overall performance of networks, servers, and applications. Being able to see which links are congested, which services are consuming the most resources, or which time zones are causing peak loads helps to adjust configurations, balance loads, redefine QoS policies, and, in general, get better performance from the installed technology.
Another increasingly important aspect is regulatory compliance. A good monitoring system facilitates access control, the tracking of sensitive data, and the detection of unauthorized access , providing logs and metrics useful for audits and for demonstrating compliance with regulatory or contractual requirements.
Finally, from a business perspective, these solutions become decision support tools : periodic reports, executive dashboards, historical analysis of incidents and availability, comparisons between sites or cloud providers… all of this helps to justify investments, negotiate with third parties and prioritize IT projects.
Specific advantages of open-source monitoring software
The first obvious advantage of open-source tools is their cost-effectiveness: there are no closed licenses or aggressive per-device costs like those found on many commercial platforms. This doesn't mean everything is free (there are always infrastructure, support, and training costs), but the savings on licenses free up space to invest in other critical areas.
The second major strength is community support and innovation . Projects like Nagios, Zabbix, Prometheus, LibreNMS, and Netdata have very active communities that develop plugins, integrations, dashboards, and constant improvements, as well as quickly fixing bugs and closing vulnerabilities.
It also stands out for its code transparency and trustworthiness : as open-source software, anyone can audit how data is processed and stored, review system security, and adapt the source code to specific needs. This reduces the risk of hidden backdoors and makes it easier to comply with internal security policies.
Another key point is avoiding vendor lock-in. With open solutions, it's easier to migrate between tools or combine them (for example, using Prometheus for application metrics, Zabbix for network devices, and Grafana as a unified visualization layer), without being tied to a single company's roadmap for life.
Obviously, open-source tools usually require a certain level of technical skill for installation, configuration, and maintenance , but in return they offer flexibility and power that compete head-to-head with many commercial solutions, especially in environments where customization and integration with existing systems are valued.
Top open-source monitoring tools for networks and infrastructure
There are dozens of mature projects focused on monitoring networks, servers, applications, and cloud environments. Below is an overview of the most relevant open-source tools for network traffic and observability , based on various technical analyses and specialized comparisons.
One of the classic examples is Nagios Core , a highly robust monitoring and alerting engine. It serves as the foundation for multiple Nagios projects and handles scheduling checks, processing results, managing events, and generating alerts. Its modular architecture allows for extending capabilities through custom APIs and plugins, and its ecosystem is vast, with integrations for almost any type of device or service.
Another giant in the open-source world is Zabbix , which is heavily focused on monitoring large-scale IT infrastructures. It is especially powerful for collecting and analyzing network device metrics (bandwidth usage, interface status, links, packet loss, temperature, CPU, memory, etc.), either through SNMP or with its own agents. It allows users to define thresholds, alert escalation flows, schedules, notification channels, and highly granular event logic.
In the realm of cloud-native applications and time-series data, Prometheus stands out . This solution uses a dimensional data model, identified by metric names and key-value tags, and leverages the PromQL query language to create charts, tables, alert rules, and complex queries. Its data is stored efficiently in memory and local disk, making individual instances highly autonomous, and it integrates seamlessly with Grafana for visualization.
For those seeking a lightweight solution focused on very short real-times and minimal latency, Netdata is a very interesting option. It installs as an agent on each Linux server or device, collects system and application metrics, stores the data on the node itself (without relying on external databases in the short term), and offers automated dashboards with highly detailed performance visualizations, even leveraging machine learning models to detect anomalies.
Specialized tools for networks and traffic visualization
Beyond general-purpose platforms, there are open-source tools that directly target network traffic monitoring and performance graphs , especially useful when the focus is on viewing bandwidth, flows, and link health.
One of the most popular is Cacti , which focuses on creating network graphs and managing faults for operational monitoring. It uses RRDTool to store data and generate graphs, offers templates to automate device registration, and supports multiple data acquisition methods. Its plugins (THold, SysLog, MacTrack, among others) allow for thresholds, syslog integration, MAC address tracking, and real-time device monitoring.
Another very powerful platform is OpenNMS Horizon , considered one of the first fully open-source enterprise-level network service monitoring solutions. It supports monitoring of local and distributed networks, offering inventory, fault management, remote data collection, alarm correlation, business service monitoring, and traffic monitoring. Everything is managed through an intuitive web interface with customizable dashboards.
In a similar vein, Icinga positions itself as a modern evolution of the Nagios model, with a polished web interface and a strong focus on network monitoring, interface performance, bandwidth usage, errors, CPU and memory load, and hardware health. Icinga supports SNMP checks, vendor-specific metrics, and SNMP trap reception, integrating with Logstash to manage events from multiple devices.
For those who need a very detailed view of network devices, interfaces, and traffic, projects like LibreNMS and Observium are especially useful. Both rely heavily on SNMP and discovery protocols (CDP, LLDP, OSPF, BGP, ARP, etc.) to automatically discover the network, generate maps, and present performance metrics with clear graphs , configurable thresholds, and flexible alerting systems.
Advanced visualization with Grafana and Graphite
In many complex deployments, the metrics collection layer is separated from the visualization layer. Two key projects in this approach are Grafana and Graphite , both open source and widely used in enterprise environments.
Grafana is a cross-platform, plugin-enabled tool designed to create fully customized data visualization dashboards. It allows you to connect multiple data sources (Prometheus, Graphite, InfluxDB, MySQL, cloud providers, etc.) and display metrics in histograms, geographic maps, heat maps, line graphs, tables, and many other types of visualizations. It supports real-time annotations, dynamic dashboards, and the definition of alerts with notifications to various channels.
Graphite focuses on capturing and graphing time-series metrics. It can be deployed on simple hardware or in the cloud and is ideal for monitoring the performance of websites, enterprise services, servers, and network metrics . Many teams opt for Graphite-based managed services (such as MetricFire) that add clustered storage, data labeling, additional integrations, and multi-channel alerting, while still leveraging the power of Graphite and often Grafana for the front end.
In a typical deployment, network systems and servers send metrics to Graphite or a compatible collector (e.g., using protocols such as StatsD), and then dashboards are built in Grafana to provide a unified view of the state of the entire infrastructure: from traffic on each interface to query latency or CPU usage per service.
Other relevant open-source monitoring solutions
The open source monitoring ecosystem is very broad and covers specific needs such as automatic discovery, process monitoring, observability pipelines, or the collection of metrics from very heterogeneous environments.
For example, Checkmk is a highly scalable platform capable of monitoring everything from small environments to large enterprises. It includes advanced agent management, automatic network discovery, interactive visualizations, powerful alerting systems, SLA reporting, log and event analysis, and APIs to extend its functionality. It is offered in different editions (free RAW, Enterprise, Cloud, and MSP), adapting to various sizes and service models.
M/Monit focuses on monitoring and self-repairing Unix and Linux systems. It monitors processes, CPU and memory usage, and network interfaces, and can automatically react to errors by performing corrective actions. It also allows you to monitor service startup, scan files and directories for unauthorized changes, and check network connections to local or remote servers.
In the realm of network topology and metrics analysis, Pandora FMS stands out as an all-in-one solution, offering network, UX, cloud, server and application monitoring, inventory, log management, and customizable dashboards. It can automatically detect network interfaces, create maps, display real-time statistics on bottlenecks, and provide comprehensive reports.
For modern microservices and multi-cloud architectures, Sensu acts as a kind of centralized observability pipeline that unifies various monitoring tools. It offers health checks, custom performance metrics, log management, network issue management, and multi-channel alerting with deduplication. Furthermore, it supports self-healing by executing service restarts or custom scripts when it detects problems.
Agents, collectors, and auxiliary tools
In addition to the large platforms, there are lighter tools whose main function is to collect and send metrics from systems, sensors, and applications to databases or main monitoring systems.
A prime example is Telegraf , a Go-based agent with no external dependencies, capable of operating through a vast plugin system. With over 300 input/output plugins, Telegraf can extract metrics and events from diverse technology stacks and send the data to systems such as InfluxDB, Graphite, OpenTSDB, Datadog, Librato, and others. Its in-memory buffers ensure that metrics are not lost even if the main backend is temporarily down.
Another important element in many architectures is the use of specific exporters and collectors (for example, in the Prometheus ecosystem, with exporters for databases, web servers, queuing systems, etc.), which allow metrics to be exposed in a standard format without having to rewrite each application.
By combining agents such as Telegraf, specialized exporters, and time series and visualization platforms, it is possible to build very complete solutions for monitoring networks, servers, applications, and clouds , completely based on free software or with minimal commercial components when official support is desired.
This modular approach has the advantage that each organization can select only the pieces it needs , integrate them with its existing systems (ticketing, CMDB, SIEM, etc.) and evolve the architecture as the environment grows or changes towards containers, Kubernetes or serverless services.
How to choose the best open-source network monitoring tool
Before installing the first popular tool, it's important to clearly define what you want to monitor : just the physical network (routers, switches, access points), or also servers, virtual machines, containers, applications, or even user experience and cloud services. This prioritization allows you to narrow down the range of options and choose solutions that fit well with your primary use case.
It's important to assess the key functionalities you need: reports, alerts, data visualization, historical data storage, integration with third-party systems, APIs, and support for specific protocols (SNMP, NetFlow, WMI, cloud APIs, etc.). For example, Prometheus is ideal when custom metrics and complex alerting rules are required; Cacti excels at displaying network traffic graphs; and Checkmk provides interactive visualization and comprehensive SLA reports.
Ease of use and configuration is another key factor. Tools like Zabbix, Netdata, or Checkmk typically offer user-friendly setup wizards and dashboards, while highly flexible solutions may require more initial setup. It's advisable to test the network discovery interface, host and service creation, and alert configuration before making a decision.
In terms of security, it is essential that the platform supports encryption, strong authentication, and role-based access control . Some, such as OpenNMS, Icinga, or Prometheus, allow the addition of advanced modules or configurations to strengthen security, segment data access, and comply with internal or regulatory standards; furthermore, it is advisable to complement this with best practices for advanced firewall configuration on servers.
Finally, it is highly recommended to perform a proof of concept (POC) with 2 or 3 finalist tools , deploy them in a controlled environment, monitor a representative subset of the infrastructure and evaluate the performance, ease of use, quality of alerts and integration capability with existing tools (ticket systems, CI/CD, messaging, etc.).
Best practices for effective network monitoring
Once the platform is chosen, success largely depends on how the deployment is designed. A crucial first step is to document and map the network : what devices are present, where they are located, what links they use, what critical services they support, and what dependencies exist between them. This will make it easier to define what and how to monitor. To better understand network topologies and types, see Computer Networks: Types and Examples.
It is advisable to choose one or more standard communication protocols for devices to send information to the tool: SNMP for network equipment, agents for servers, Prometheus exporters for specific services, syslog for events, etc. The more homogeneous the approach, the easier it will be to maintain in the long term.
It is also important to define baseline behaviors : normal values for latency, bandwidth, CPU, memory, concurrent connections, etc. This allows for the configuration of realistic thresholds and more accurate detection of anomalies, avoiding both false alarms and missed alerts for real incidents.
Setting up clear, role-specific dashboards (24/7 operations, network, systems, management, etc.) helps reduce diagnostic time. A NOC will need summary views and real-time alerts; a network administrator, detailed interfaces, errors, and queues; and a CIO, availability and SLAs for critical services.
Finally, it's essential to define an alert escalation policy : who receives what type of alert, through which channel, and with what priority; what is done outside of working hours; what constitutes a major incident; and how the response is coordinated between teams. Even the best tools in the world lose effectiveness if no one responds to alerts or if there isn't a clear action plan.

Taking all these pieces into account, open-source network traffic monitoring solutions allow you to build super-robust environments, with end-to-end visibility, decision support, and a solid foundation for improving the security, availability, and performance of any infrastructure, from a small business to a large distributed corporation.