- The Task Manager centralizes control of system processes, services, and resources in all modern versions of Windows.
- Each tab (Processes, Performance, Startup, Users, Details, and Services) offers specific information to diagnose problems and optimize performance.
- Advanced features such as analyzing wait chains, creating memory dumps, and managing startup allow you to resolve locks and speed up boot times.
- Using Task Manager shortcuts, views, and menus correctly makes this tool an essential resource for both home and professional computers.
If you use Windows daily, Task Manager is one of those tools you should master . It's not just for killing programs that have frozen; it also lets you monitor your computer's performance, control what runs at startup, and even investigate if something unusual is consuming resources in the background.
Throughout this article, you'll learn exactly what the Windows Task Manager is, how to open it in all possible ways, and how to get the most out of each of its tabs . You'll see basic functions and some more advanced options designed to diagnose problems, both on a home PC and on workstations or Windows servers.
What is the Windows Task Manager and what is it used for?
Task Manager is a built-in application in all modern versions of Windows (from Windows XP onward, including Windows 8, 10, 11, and Windows Server). It requires no installation, cannot be uninstalled, and is part of the operating system itself.
Its main function is to provide real-time information about running programs, processes, and services . It also displays hardware resource usage: CPU, RAM, disk, network, GPU, and even approximate energy consumption.
In practice, it's used for three main things: monitoring performance, closing problematic processes, and managing application startup . But if you dig a little deeper, it can also be used to analyze wait chains (why a process is blocked), generate memory dumps for technical support, manage system services, or compare resource consumption between users on the same machine or compare it with Process Explorer.
Internally, Task Manager draws on various data sources and internal Windows APIs . While the interface varies slightly depending on the version (it's not the same in Windows 8 as in Windows 11, for example), the core information comes from the same system counters and kernel services.
How to open Task Manager in Windows
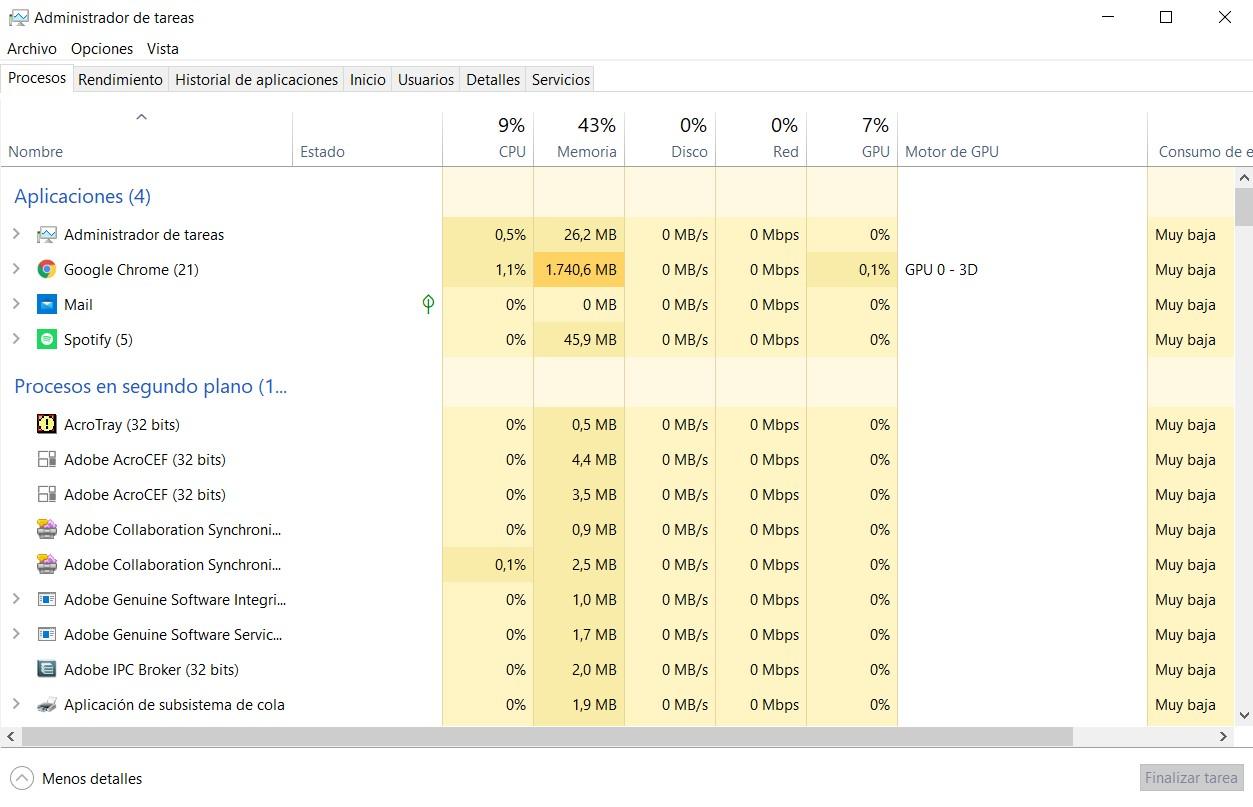
One of the advantages of this tool is that you can launch it in many different ways , which is very useful when the system is slow or part of the interface is not responding well.
The most common method on modern computers is to right-click on the Windows taskbar and select "Task Manager" . It's fast, easy to remember, and works on the vast majority of client versions.
You can also use keyboard shortcuts; see our guide to keyboard shortcuts in Windows . In Windows 10 and Windows 11, the Ctrl + Shift + Esc combination opens the Task Manager directly without going through any intermediate screens. It's a good idea to memorize it because it works even when the Desktop is choppy.
Another classic is the Ctrl + Alt + Delete combination . In Windows NT, 2000, Vista, 7, 8, 10, 11, and Windows Server versions, this command displays a security screen with various options, including access to the Task Manager. In Windows XP, this combination could directly open the Task Manager or the Welcome screen, depending on the configuration.
If you prefer a more direct approach via command line or shortcut, the executable is called taskmgr.exe and is located in C:\Windows\System32 . You can run it from the Run dialog box (Win + R), from the Start menu by typing taskmgr , from PowerShell, from the Command Prompt, or by creating a shortcut on the Desktop.
Compact view and detailed view: two ways to use it
In modern versions of Windows, Task Manager offers two display modes: compact and detailed . When first opened on some systems, it only shows a very simple list of running applications and a button to "End task".
This compact mode is designed for users who only need to quickly close a program that has frozen . If you want to see all the advanced information, simply click on "More details" in the lower left corner. The manager will expand, and all the tabs and columns will appear.
You can return to simple mode at any time by selecting "Fewer details" . This is useful when all you want to do is see which apps are open without being distracted by background processes.
Processes tab: applications, background processes, and resource consumption
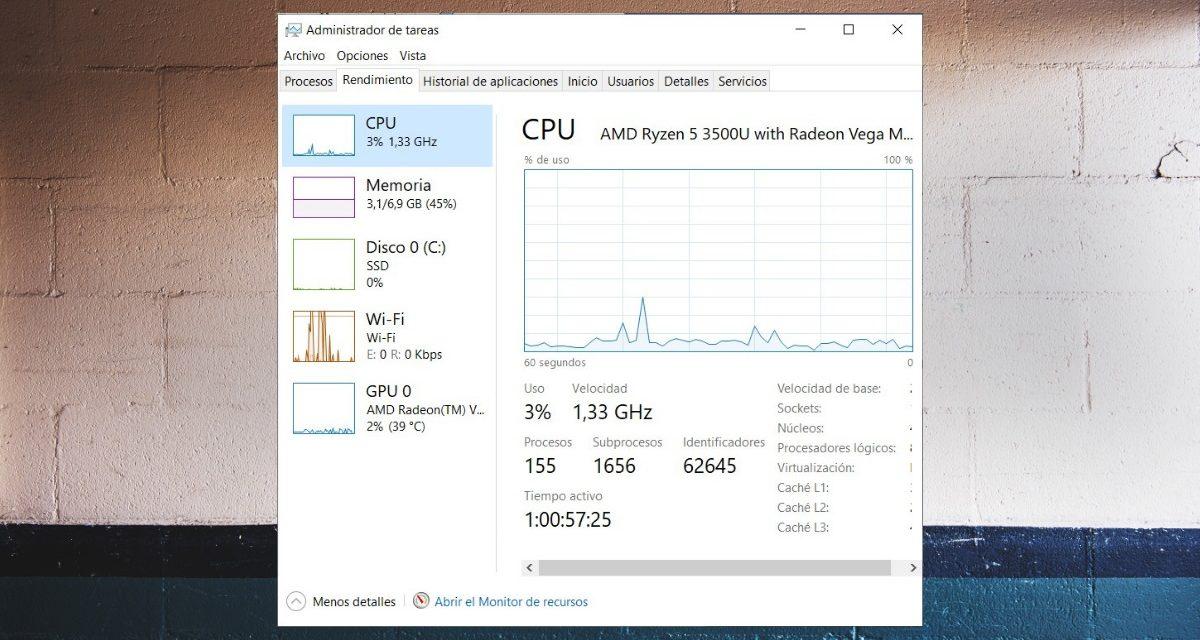
The Processes tab is the main "control window" for seeing what's happening on your PC. It lists, in sections, open applications and background processes along with their resource usage.
For each element, columns such as Name, Status, CPU, Memory, Disk, Network, GPU, GPU Engine, Power Consumption, and Power Consumption Trend are displayed . Each provides key data:
- CPU: percentage of processor usage that the process is currently consuming.
- Conference proceedings: amount of RAM used by that task.
- Disc: read/write speed that the process is performing on the drive.
- Red: Network traffic associated with the process, ideal for seeing which program is saturating your connection.
- GPU and GPU Engine: use of the graphics card and the specific engine (3D graphics, video, etc.).
- Energy consumption: estimation of the impact of that process on the system's energy use.
From here you can quickly identify which program is using up the CPU or RAM . If your computer is running very slowly and you see a process using 90% of the CPU, you've already identified the culprit.
Right-clicking on any process opens a menu with several actions: Expand (to view grouped processes from the same application), End task, Change resource values, Go to details , Open file location, Search online, and Properties . These options allow you to both close processes and investigate exactly what they are and where they are installed.
The "Search online" option launches a search in your default browser using the process name , ideal when something strange appears that you don't recognize and you want to know if it's legitimate or potentially dangerous. "Open file location" takes you to the executable file on your disk, which can help you remove unwanted software.
Performance tab: monitor CPU, memory, disk, network, and GPU
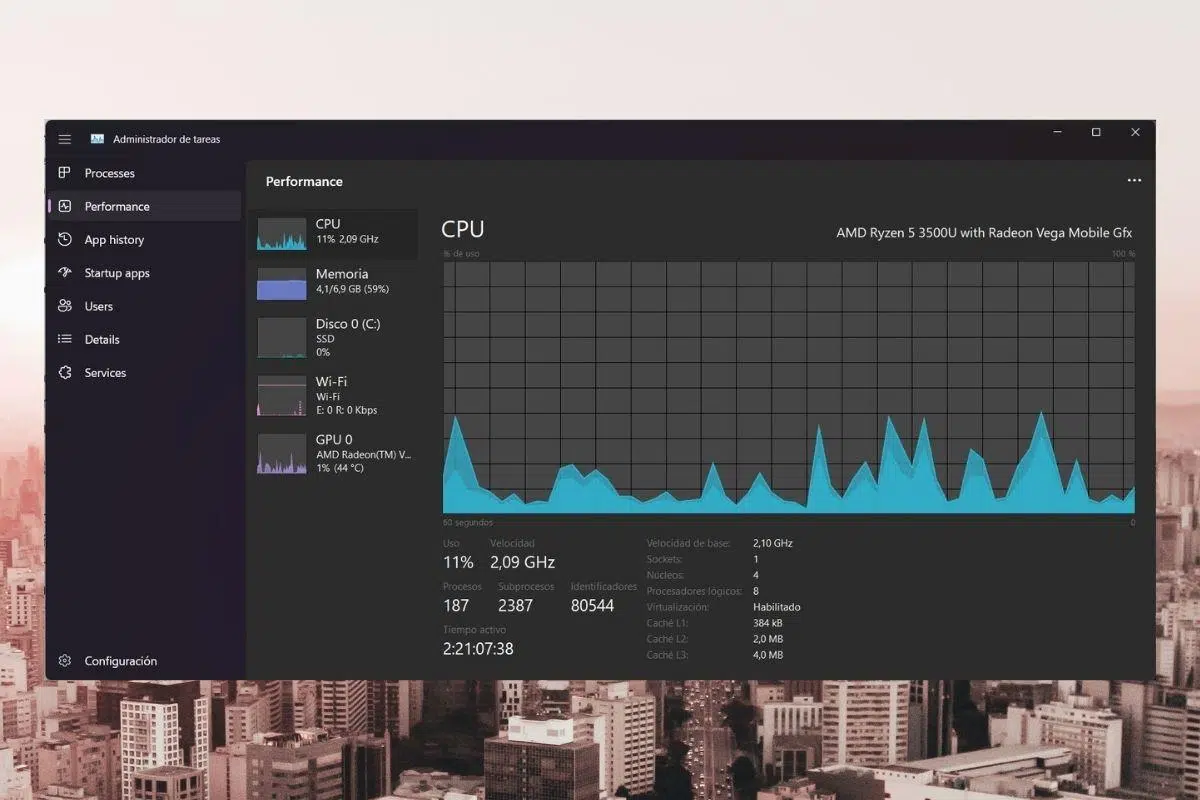
The Performance tab displays real-time graphs of the main system components . It's the best way to determine if your computer's bottleneck is the CPU, RAM, disk, or network connection.
In the CPU section, you'll see the total processor load and its current frequency , as well as the number of active processes, threads, and identifiers. If your processor has multiple cores and logical threads, you can switch the view to show a graph for each logical processor, allowing you to see whether the load is distributed or concentrated.
Task Manager even allows you to distinguish between user CPU time and kernel CPU time . If you right-click on the CPU graph and select "Show kernel times," the graph is colored in two shades, differentiating the work of the Windows kernel from that performed by user applications. This is useful for determining whether the load is coming from drivers/system or user programs.
The Memory section displays how much RAM is in use, how much is free, how much is cached, and other technical data . On systems with limited memory, this tab helps justify upgrades when usage remains consistently high.
The Disk, Network, and GPU sections display activity graphs and specific details : drive type (HDD or SSD), transfer speed, network adapter usage, link speed, graphics card usage, GPU temperature (on some models), and more. For more in-depth information on drives and partitions, see Disk Management in Windows.
If you want a cleaner view to tuck away in a corner, you can right-click on any chart and select "Summary View ." The Task Manager will shrink and show only the real-time usage panels, without the process list.
App history: which apps have consumed resources
In versions like Windows 8 and Windows 10 there is an App history tab , designed mainly for Windows Store apps, although it can provide a general idea of historical usage.
Here you'll see which apps you've had open during a specific period and what resources they've consumed , especially in terms of CPU and network usage. It's a quick way to identify which apps are running excessively in the background even when they're no longer open.
If you want to erase all traces of that history, the Task Manager itself allows you to clear usage data . Simply go to the Application History tab and click the button to clear the usage history. From that moment on, the statistics will start from scratch.
Startup tab: control of programs that load with Windows
One of the most effective ways to speed up a PC is to check what runs at startup . The Startup tab in Task Manager displays the list of applications configured to launch with Windows.
In addition to the name of each program, its status (enabled or disabled) and its impact on startup (low, medium, high) are displayed . This way, you can easily identify those assistants, updaters, and small utilities that sneak into startup and slow everything down without providing any critical benefit.
To disable an application from starting automatically, simply right-click on it and select "Disable ." The program will remain installed and can be used normally, but it will no longer launch processes every time you turn on your computer.
If, on the other hand, you want a tool to always start (for example, a corporate VPN or a synchronization utility), simply leave it enabled in this tab.
Users tab: consumption per user session
On shared computers, especially in office or classroom environments, the Users tab lets you see who is using what . It lists the user sessions that have logged into the computer along with the processes associated with each one.
This is very useful when a work computer is running slowly and you want to know if it's due to your session or another user who left something running in the background. From this tab, you can expand each user to see their applications and processes and, if you have permission, close sessions or end specific tasks.
Details tab: advanced process view
The Details tab is the advanced view designed for experienced users and administrators . Unlike "Processes," which groups and presents information in a more user-friendly way, "Details" offers a flat list of all processes with very specific data.
Here you can see, in addition to the process name, the PID (process identifier), the user under which it is running, its status, resource consumption, and additional descriptions . This is the tab you jump to when you need to work with very specific processes or cross-reference information with external tools.
Right-clicking on the column headers allows you to customize what data is displayed . For example, it's common to add a "Threads" column to see how many threads a given process is using, which is crucial when analyzing resource-intensive applications.
From a process's context menu, you can set priorities, change CPU affinity, terminate the process, or terminate the entire process tree. These options allow you, for example, to reduce the priority of a task that is hogging the CPU without having to close it.
Task Manager also offers the option to create a memory dump file for a process . This feature generates a file containing the internal state of the process at that moment, which can be sent to technical support or analyzed with specialized tools to diagnose complex failures.
Services tab: advanced control of system services
The last tab, Services, lists all services registered in the system with information such as name, process identifier (if it is running), a brief description and its status (started or stopped).
The format is very similar to the classic Services console ( services.msc ), but integrated directly into Task Manager. From here you can start, stop, or restart services , as well as use the "Go to Process" option to locate which process is associated with a specific service.
Some services can be grouped or display information about restrictions and returned parameters, which helps to better understand the relationship between services and system processes . This tab is especially valuable for diagnostic tasks on Windows servers or critical workstations.
How to use Task Manager to troubleshoot problems
Beyond simply looking at numbers, Task Manager is a practical tool for diagnosing and resolving everyday issues. Here are some real-life situations where it makes a difference.
Check CPU load and locate bottlenecks
If you notice your computer is lagging, the first thing to do is usually open the Performance tab and check the CPU graph . If it's constantly near 100%, something is pushing the processor to its limits.
On systems with multiple logical processors, you can right-click on the graph and switch the view to "Logical Processors" to see the individual usage of each core. For example, on a machine with eight logical processors, a constant load of 12,5% might be equivalent to one core working at 100% (100 / 8 = 12,5). This reference helps to better interpret the percentages.
If you also enable kernel timings , you can see what portion of that load comes from Windows and its drivers and what portion from user applications. If most of it is kernel, there might be a malfunctioning driver or service; if it's user applications, you'll need to check the Processes tab to see who's using the CPU.
Force the closure of suspended processes
It's quite common for an application to appear to close but leave a process running in the background that continues to consume resources . In these cases, going to the Processes tab, locating the app, and using "End task" is usually the quickest solution.
If there are multiple processes associated with that application, you can expand the group (using the side arrow) and terminate only the problematic one . In extreme cases, the Details tab offers the option to "Terminate process tree," which terminates the selected process and all its dependent processes.
Analyze waiting chains when a process is unresponsive.
There are situations where a process appears as "Running" but isn't responding correctly because it's waiting for another process or resource . Task Manager can help you with this using its wait chain analysis feature.
To use it, go to the Details tab, select a running process, right-click, and choose "Analyze wait chain ." If the process is not blocked by others, you will see a message indicating that it is running normally.
If a dependency exists, a tree will appear showing all the processes that the thread depends on . In some cases, selecting one or more of these processes and clicking "End Process" can break the lock and allow you to resume the main application (although this should be used with caution, as it could close critical components).
Detect resource-intensive or suspicious software running in the background
When your computer is slow and you don't have any resource-intensive applications open, it usually means that a background process is consuming resources . The combination of the Processes tab and the CPU/memory usage column is key to identifying the problem.
Once you've identified the problematic process, the next step is to find out exactly what it is . This is where the "Search online" and "Open file location" options in the context menu come in. If the search points to legitimate software (antivirus, cloud backup tool, etc.), you can adjust its settings. If it appears to be something unknown or malicious, you can remove spyware , disable it from startup, or run a more thorough security scan.
Restart Windows Explorer without restarting the PC
Another little-known feature is that you can restart Windows Explorer directly from the Task Manager when the taskbar or desktop freezes . Simply locate "Windows Explorer" in the list of processes, right-click it, and select "Restart."
If Explorer has disappeared completely, you can also go to the File menu > Run new task , type explorer.exe and press Enter to reload it without restarting the entire system.
File, Options, and View menus: extra settings from the Manager
At the top of the Task Manager you will find three menus that add useful functions: File, Options, and View.
From the File menu, you can start a new task (launch a program, open a document, run a command) or exit Task Manager. The new task function is especially useful when the Start menu or taskbar is unresponsive.
In Options , you can configure, among other things, whether the Task Manager window always remains visible in the foreground , automatically minimizes when opened, or hides in the notification area next to the clock. These are practical settings if you want it constantly monitoring the system while you work.
Finally, the View menu allows you to manually force data updates and adjust the refresh rate . Reducing the refresh rate can be useful on machines with limited resources, as the administrator itself consumes some CPU to collect and display data.
Overall, the Windows Task Manager becomes a Swiss Army knife for understanding what your computer is doing at any given moment , optimizing startup, locating bottlenecks, controlling services, and, when necessary, killing rogue processes without having to restart. Mastering it makes the difference between going in blind when your PC freezes and having a reliable tool to regain control in just a few clicks.