- Windows 11 does not display CPU temperature; use BIOS/UEFI or third-party apps.
- MSI Afterburner+RTSS, HWiNFO, HWMonitor, Core Temp, and Speccy are reliable options.
- Safe ranges: <60 °C ideal; 60–70 normal; 70–80 acceptable; >90 critical.
- Cleaning, thermal paste, airflow, and fan curves reduce temperatures.
If you use Windows 11 and are worried about how hot your computer is getting, you're not alone: heat is hardware's number one enemy . Components perform according to the workload, and that effort translates into temperature. That's why, when the system gets too hot, you'll experience performance drops, fan noise, and, in the worst-case scenario, safety shutdowns.
It's important to understand one thing from the start: Windows 11 barely displays native temperatures. You'll see the GPU temperature in Task Manager , but not the CPU temperature. So, if you want to know the processor's temperature in real time, you'll need to use the BIOS/UEFI or third-party applications , such as our guide on checking CPU temperature in Windows 11. Below, we'll explain all the working options, how to configure them, and what temperatures are reasonable to avoid any surprises.
Why you should monitor your CPU temperature in Windows 11
PC chips are designed to operate within a safe thermal range . Exceeding this range for extended periods is usually a sign of a problem: a poorly installed heatsink, dried-out thermal paste, dust, or inadequate airflow in the case.
There are certain user groups who should be especially careful: those who play demanding games, those who edit video, render, or work with design software , and those who open many applications simultaneously. On laptops, the risk is higher because the space is smaller and heat builds up faster.
Beyond simply being careful, monitoring the temperature helps confirm whether your cooling system is doing its job. If the CPU gets too hot, it may enter thermal throttling and reduce performance to protect itself, or it may cause the fans to spin up and the computer to become louder than is tolerable.
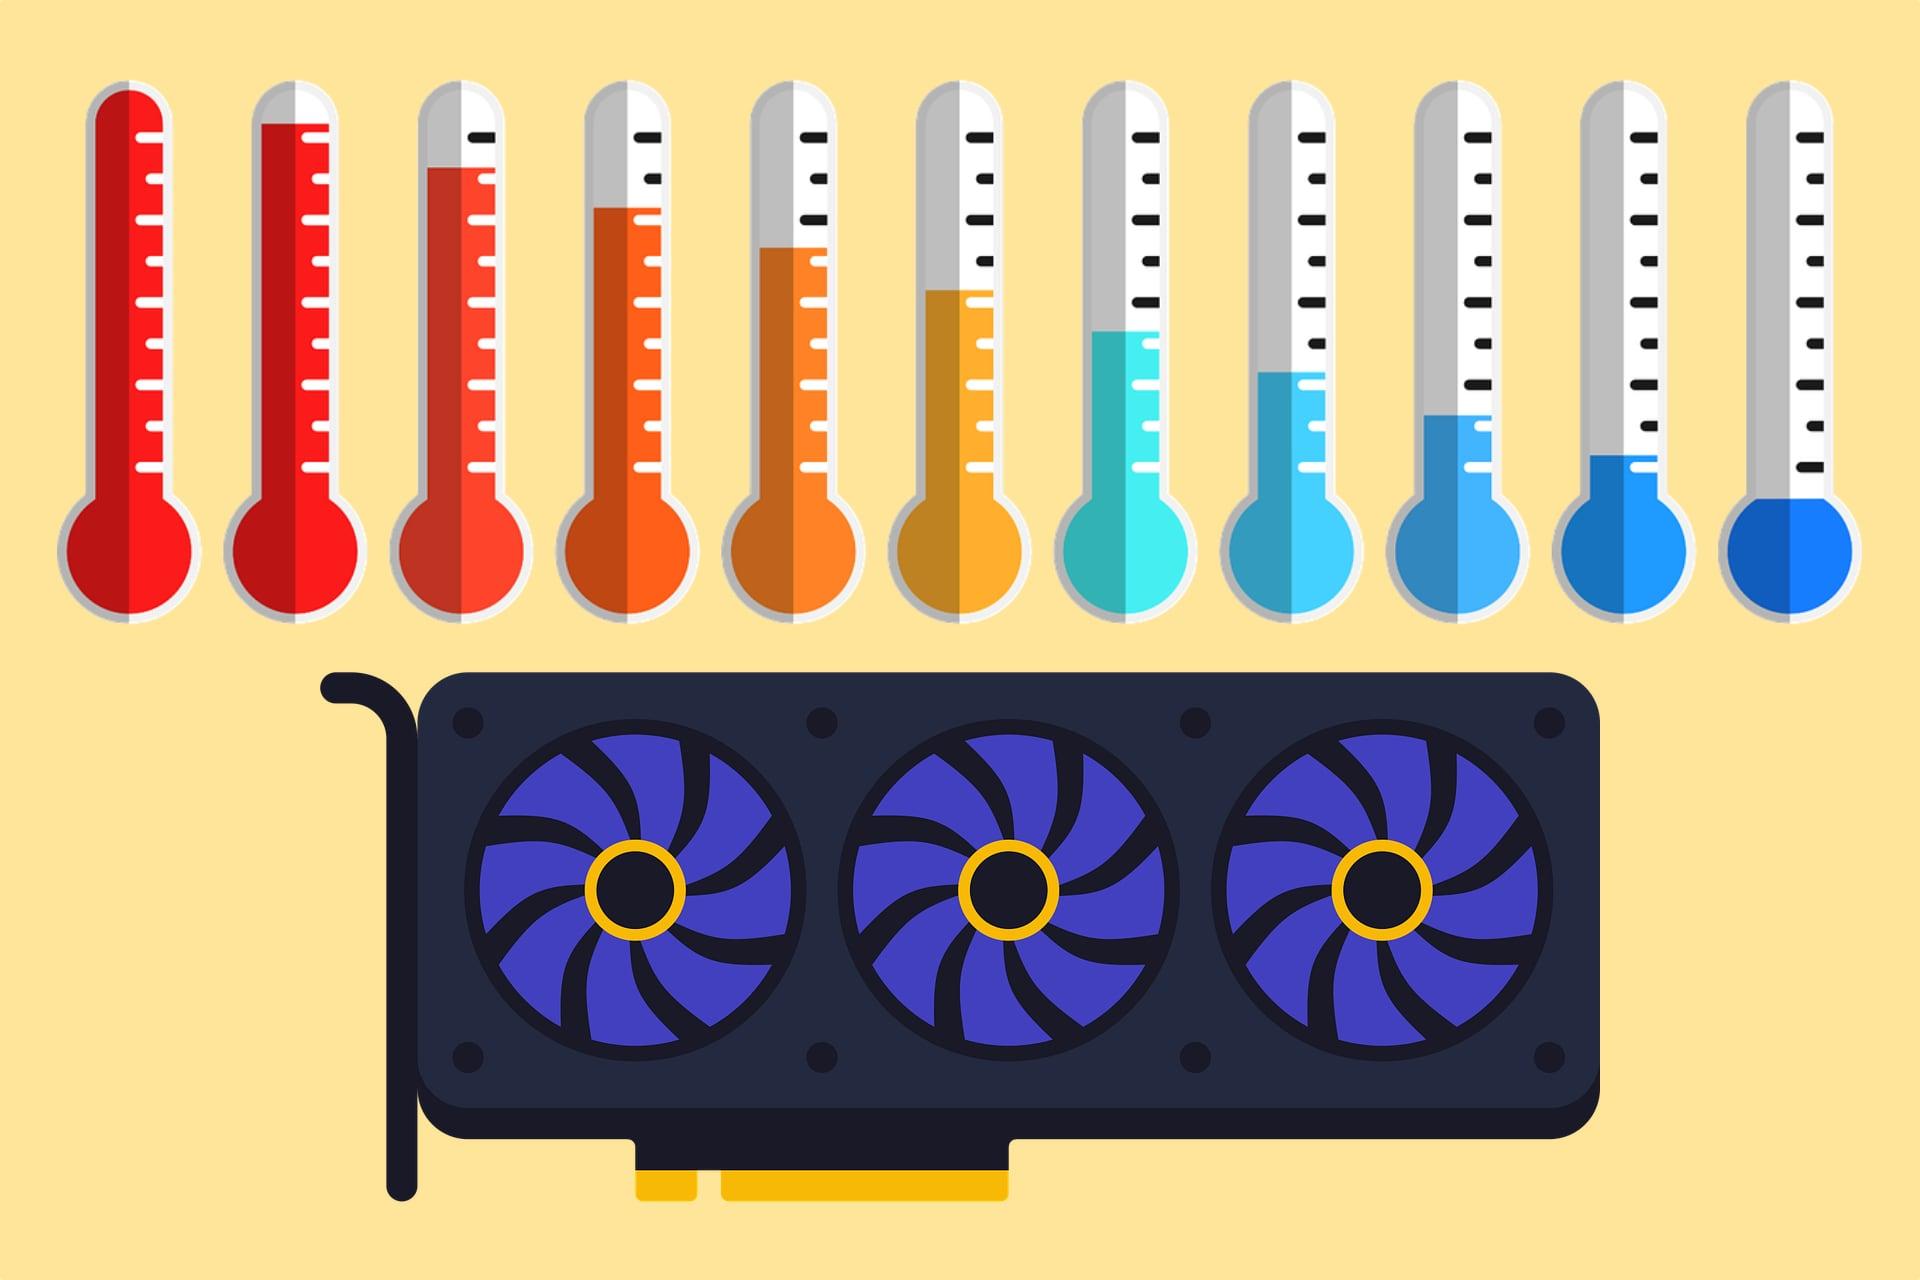
As a practical reference, these ranges can help guide you: less than 60 °C is ideal at rest or for light tasks; between 60-70 °C is normal for gaming and medium load; 70-80 °C is acceptable under heavy load (keep an eye on it); 80-90 °C is already a cause for concern if you're not overclocking ; and above 90 °C you need to take immediate action.
What Windows 11 shows (and doesn't): Task Manager, official apps, and limitations
Windows 11 doesn't offer a native CPU temperature display. In Task Manager (right-click on the taskbar > Task Manager), under the "Performance" tab, you'll see the GPU temperature , but the CPU temperature is missing. This is a gap that many users have requested be filled, but it remains unresolved.
The situation becomes more complicated after certain system updates: according to reports in the Microsoft community, some hardware monitors stop reading sensors immediately after a major Windows 11 update until their developers release a compatible version. Once these apps are updated, the data returns to normal.
If you're interested in the GPU, the official applications can help. With the NVIDIA App , you can activate the statistics module to view CPU/GPU usage, graphics card temperature, FPS, and latency during gameplay. For AMD Software , go to "Performance" > "Metrics" to view temperature, usage, FPS, and other data, with the option to log metrics using the " Start Logging" button.
In short: for CPU monitoring, you'll need to rely on the BIOS/UEFI or third-party software . And if something stops being measured after a Windows update, check if there's a newer version of your preferred tool.
View CPU temperature from BIOS/UEFI
The BIOS/UEFI is the universal way to verify that everything is working correctly at the sensor level. In Windows 11, you can access it without pressing any keys during startup: open the Start menu, hold down the Shift key , and choose "Restart." This will take you to Advanced Boot Options; go to " Troubleshoot " > " Advanced options " > " UEFI Firmware Settings " and click "Restart" to access it.
Within the BIOS/UEFI, look for a Hardware Monitor section or something similar. There you'll usually see the "CPU Core Temperature" and sometimes voltages and fan speeds. Keep in mind that the system is idle, so the temperature will be lower than under load; even so, it's useful for confirming that the sensors are working and that nothing is running rampant right after startup.
Not all BIOSes display the processor temperature. If your firmware doesn't show it, or if you're interested in measuring it in real time while gaming or working , you'll need to use specialized applications.
Reliable apps for viewing CPU temperature in real time
The community has been using long-standing utilities for years that read system sensors and display their information on the screen, in the system tray, or in a statistics panel. These are the most comprehensive and popular options for Windows 11.
MSI Afterburner + RivaTuner Statistics Server (OSD in your games)
MSI Afterburner is free and, together with RivaTuner Statistics Server (RTSS), allows you to overlay an on-screen display (OSD) with key data during full-screen games or apps. In Afterburner's settings, open the "Monitoring" tab and select the sensors you're interested in (CPU temperature, GPU temperature, CPU usage, etc.). Enable "Display on screen" to display them on the OSD in real time.
If you also want to see them when you're not in a game, enable "Show in system tray" so the number stays fixed next to the clock. The overlay usually appears in the top left corner, although you can change its position, size, font, and color; by default, many elements are displayed in red , but this is configurable.
Speccy (CCleaner)
Speccy offers a quick overview of all your hardware: CPU, RAM, motherboard, storage, GPU, and, depending on your system, it will display the temperature of the processor and other components. It doesn't always show every reading, but it's easy to use and allows you to save a report with your complete PC configuration.
Open Hardware Monitor
A minimalist alternative that gets straight to the point. After installing Open Hardware Monitor, you'll see a list of sensors: CPU core temperature , bus speed, voltages, GPU temperature, and fan speed. To keep the temperature information readily available, right-click on the CPU reading and select "Display in tray."
Core Temp
Core Temp is one of the lightest apps and focuses on the CPU. Its panel displays the model, frequencies, and, in the " Temperature Readings " section, the current and maximum temperatures per core. From "Options" > "Settings," you can enable it to appear in the notification area of the taskbar, ideal for a quick glance.
If you're using an AMD Ryzen processor, you'll see two values: Tdie (the actual core temperature) and Tctl (the temperature control used by the system to manage the fans). To evaluate your CPU, focus on Tdie; Tctl may include an offset that doesn't accurately reflect the silicon's heat.
HWMonitor
A true classic. HWMonitor reads all the sensors your PC displays: voltages, temperatures, fan speeds, clock speeds, battery level, and more. It includes per- core CPU readings and GPU temperature. It has versions for x86/x64 and ARM64, and a paid edition with extra features if needed.
HWiNFO
HWiNFO is probably the most comprehensive tool for inventory and monitoring. It features a "sensors only" mode, provides real-time measurements , and can generate detailed logs and reports. It is widely used in professional environments and has both installable and portable versions for x86 and ARM64.
NZXT CAM
Focused on user experience and with a mobile app, NZXT CAM offers clear dashboards for viewing system temperatures and usage . It's not the most technically comprehensive, but it's convenient if you want something visual and easy to understand.
Manufacturer apps: NVIDIA App and AMD Software
If you're interested in monitoring your performance while gaming, the official GPU apps are invaluable. In the NVIDIA App, activate the statistics module to see CPU and GPU usage, graphics card temperature , FPS, and latency on screen. In AMD Software, go to the "Performance" > "Metrics" section for live data and, if you like, log sessions using "Start Logging."
Software included by the equipment manufacturer
Some manufacturers pre-install utilities that already display these metrics. For example, gaming desktops and laptops often include real-time dashboards (such as OMEN Gaming Hub on HP systems), and if you have a Ryzen processor, AMD itself offers Ryzen Master as a specific tool for managing and monitoring the chip's performance.
Safe ranges, TjMax, and how to interpret what you see
Besides looking at numbers, you need to understand them. Generally, working below 60°C for light tasks is ideal. Between 60 and 70°C is expected when gaming or under moderate load. 70-80°C is acceptable if you're rendering or in intensive sessions, but it's still worth monitoring. Between 80-90°C indicates you need to improve airflow or cooling if you're not overclocking. Above 90°C is dangerous territory: stop, check, and make adjustments.
For greater accuracy, look at the TjMax (maximum junction temperature) reported by some tools. This is the limit beyond which the CPU will aggressively reduce frequency or shut down to protect itself. The goal is for your peak frequencies, even under stress, to remain well below this value.
In AMD Ryzen, remember the difference between Tdie and Tctl: the former is the one you're interested in to assess whether there's a real heat problem in the cores, while the latter is used as a control signal for the fan curve and may include offsets.
What to do if your CPU gets too hot
When the temperature spikes, the first thing to do is tackle the basics. Start by cleaning the dust from the fans and heatsinks. Dust acts like a thermal blanket: it worsens heat transfer and obstructs airflow. A quick wipe with compressed air and brushes can lower the temperature by several degrees without needing to touch anything else.
If your computer is a few years old, consider reapplying the thermal paste between the processor and the heatsink. Dried-out paste loses effectiveness; using a quality compound and applying it correctly usually offers a noticeable improvement.
Check the case's airflow : front fans should be drawing air in and rear/top fans exhausting it. Check the direction of rotation, remove any obstructions, and tidy up the cables. If your case allows it, adding an intake or exhaust fan can make a big difference.
Another option is to adjust the fan curve . With utilities like SpeedFan (or those included with your motherboard), you can define at what temperature the fans increase their speed. A more aggressive curve will prevent temperature spikes, although in return you'll have more noise under load.
For more serious cases, consider improving cooling: a more capable air cooler or an AIO liquid cooling system for high-TDP CPUs. And if you're skilled, undervolting can reduce temperature and power consumption by lowering the CPU voltage; keep in mind that, depending on the margin, it may involve some performance loss and requires stability testing.
On laptops, in addition to cleaning the vents and replacing thermal paste if the model allows it, use cooling pads and avoid soft surfaces that block air intakes. Managing processes also helps: from the Task Manager, you can close applications that are using CPU unnecessarily.
When and how to measure: practical tips
Measuring temperatures at idle is useful as a reference, but what you really need to know is the temperature during your intended use . If you're gaming, monitor with an overlay like Afterburner+RTSS. If you're editing video, observe temperatures during a long export. And if you suspect thermal bottlenecks, leave a monitor in the drive bay to see peak and maximum temperatures reached.
If your tool stops displaying temperature after a Windows 11 update , don't assume the sensor is broken: look for a newer version of the app or try a different one. It's common for developers to take a few days to release compatible builds after a system change.
Keep logs whenever possible. Apps like HWiNFO or AMD Software allow you to create logs of CPU/GPU temperatures and usage . Having a log file helps you compare before and after cleaning, thermal paste replacement, or ventilation improvements.
Tools and scenarios: what to choose in each case
If you want something simple to check occasionally, Speccy or Open Hardware Monitor will suffice. For a comprehensive view with multiple sensors, HWMonitor or HWiNFO are reliable choices. If you're looking for in-game overlays, MSI Afterburner with RTSS is the winning combination. And if you have a modern GPU, enable metrics in the NVIDIA App or AMD Software for accurate data while you play.
Those who buy "gaming" equipment often already have factory software (such as OMEN Gaming Hub in certain models) with real-time panels, and if your processor is AMD, Ryzen Master adds specific options to monitor and adjust chip parameters safely.
To complete the picture, remember that the BIOS/UEFI provides a snapshot of the system at idle and confirms that the sensors are responding , but it doesn't replace live monitoring. The key is a combination of methods: validate in the BIOS, monitor the system tray daily, and use an overlay when gaming or rendering.
If you keep dust out, check thermal paste regularly, adjust ventilation, and choose your tools wisely, keeping temperatures under control is no longer a gamble. Your CPU and GPU can work hard for hours within their safe limits without problems or performance drops.
